The Point of No Return: How Technical Debt Predicts Engineering Attrition
From morale erosion to team collapse: a model, a cost comparison, and the threshold that separates the two.
The Point of No Return: How Technical Debt Predicts Engineering Attrition

At 3:10 in the afternoon, the pilot circled the narrow gulch north of Helena and radioed down: routine fire. Sixty acres, grass and scattered brush, a mild ten-mile-an-hour wind pushing gently up the canyon. Fifteen smokejumpers, the elite of the Forest Service, stepped out of the plane with the confidence of men who had seen dozens of fires like this one and knew exactly how the story ended: by ten the next morning the line would be held, by lunch it would be out. Foreman Wagner Dodge landed, adjusted his gear, and led the crew down the slope toward the river, to what every calculation said was the safer ground.
The wind turned at four o’clock. Not violently, a few degrees, then a few more. The fire that had been crawling obediently down the south slope suddenly leapt across the floor of the gulch and started climbing the dry grass of the north slope, straight toward the crew. Less than an hour separated the foreman’s first uneasy glance from the moment the fire became a hundred-foot wall of flame. And from the moment someone finally shouted to run, only minutes remained before the fire had covered the entire slope. It burned three thousand acres in ten minutes. Dodge had just enough time to strike a match, burn the ground beneath his own feet, and lie down in the ashes he’d made. The thirteen men who kept running uphill instead did not have enough time.
In under two hours, a routine wildfire killed more firefighters than almost any other fire in the agency’s history. Nothing about it looked like a disaster, right up until the moment it was too late to see it coming.
This is the Mann Gulch fire, Montana, August 5, 1949. It’s a real, heavily documented case. So well documented, in fact, that organizational theorist Karl Weick used it in 1993 as the foundation for one of the most cited papers in management science, The Collapse of Sensemaking in Organizations. Weick wasn’t writing about wildfire. He was writing about what happens inside any organization when a situation that looks completely under control crosses a threshold nobody was watching for, and collapses within minutes instead of unwinding over months.
Engineering teams have their own version of that gulch: a slow, apparently manageable accumulation of technical debt, that everyone has seen before and knows how to handle, right up until the wind changes.
Same fire, different fuel
When a team’s attrition problem gets diagnosed, the postmortem almost always points at the same three suspects: pay, career growth, culture fit. But what is hidden, the fact that they don’t explain every departure. Plenty of engineers leave organizations with competitive salaries and genuinely interesting products.
Stack Overflow’s 2024 Developer Survey, with more than 65,000 respondents, found that developers were most frustrated by technical debt at work — it topped the list of workplace frustrations that year, ahead of pay, ahead of tooling, ahead of everything else. In the same survey, the single strongest driver of developer satisfaction was “improving the quality of code and the development environment”, outranking almost everything, including learning new technology.
It’s the whole hidden mechanic in one sentence: the thing developers say frustrates them most is the mirror image of the thing that makes them happiest, and almost nobody discusses either one as a retention lever. Technical debt gets treated, universally, as an efficiency problem, a drag on velocity. It is almost never treated as a satisfaction problem, let alone a retention problem, despite being the top-ranked source of frustration in the largest developer survey that exists. That gap between how debt is discussed and what it actually predicts is the main discovery of this article.
What the research actually shows about morale
The first solid piece of ground here is a 2020 study in the Journal of Systems and Software by Besker, Ghanbari, Martini, and Bosch, built on fifteen practitioner interviews and a follow-up survey. Its core finding: technical debt reduces developers’ morale and productivity, while actively managing that debt increases both. More specifically, debt does its damage mainly through two components of morale: the sense that work is going somewhere (the “future/goal” component), and the emotional, day-to-day experience of the job. It says debt specifically kills the feeling of progress, long before it shows up as an explicit complaint.
That erosion maps almost exactly onto the clinical progression described in Christina Maslach’s burnout model: a honeymoon phase, then onset of stress, then chronic stress, then emotional exhaustion, then cynicism, then a collapse in the sense of one’s own effectiveness. Emotional exhaustion — the first clinically measurable stage, typically appears after three to six months of continuous, unrelieved overload. Sustained technical debt, left unmanaged for that same window, is exactly the kind of chronic overload the model describes. Low morale, in other words, isn’t just an unpleasant mood. Left running long enough, it is the mechanism through which burnout gets built.
From burnout to the door
The next link in the chain is one of the most replicated findings in organizational psychology: decades of meta-analyses covering hundreds of studies across industries and countries (Cotton & Tuttle, 1986; Griffeth et al., 2000; Tett & Meyer, 1993; Hom et al., 2017) show a consistent, moderate-to-strong negative correlation between job satisfaction and the intention to quit. And intention to quit is, in turn, the single strongest known predictor of someone actually leaving.
So the formed chain is a textbook, link by link:
technical debt → eroded morale (Besker et al.) → burnout, on a predictable timeline (Maslach) → intention to leave → actual departure (decades of turnover research).
Nothing in that chain requires the developer to consciously connect their frustration back to the code. The mechanism runs whether or not anyone names it.
Measuring the mechanism: what we’d need to model it
Knowing the mechanism exists is different from being able to see it coming. To build something usable, a way to actually measure how close a team is to the wind changing, we need a few more pieces of ground truth.
First: turnover doesn’t move quietly through a team, it spreads.
A 2009 study in the Academy of Management Journal by Felps, Mitchell, Hekman, Lee, Holtom, and Harman, run across 45 bank branches and over a thousand hospitality departments, found something specific — a coworker’s job embeddedness and active job-search behavior predicts an individual’s own decision to quit, independent of that individual’s personal satisfaction. In plain terms: once a few people on a team start actively looking, that alone raises the odds that others follow, regardless of how those others personally feel about their work. This is turnover contagion, and it is empirically demonstrated.
Second: the damage from attrition isn’t linear.
Large meta-analyses (Hancock, Allen, Bosco, McDaniel & Pierce, 2013; Park & Shaw, 2013), covering hundreds of thousands of observations, found that the relationship between turnover rate and organizational performance is curvilinear, moderate turnover has a weak or even neutral effect, but past a certain point the damage accelerates sharply. A study of Texas school districts (Meier & Hicklin, 2007) found the same pattern directly: low turnover correlated with better outcomes, high turnover with worse ones. There’s a bend in the curve.
Third: the price of a departure, once it happens, is steep and well quantified.
Replacing a specialized technical hire typically costs 100 — 150% of that person’s annual salary once recruiting, onboarding, and lost productivity are counted (SHRM), with some estimates running higher. A new engineer typically needs three to six months to reach full productivity, and can take up to a year to match a tenured colleague’s grasp of the system.
Building the model: stages, months, and the debt-attrition loop
Putting these four pieces together: Besker’s morale mechanism, Maslach’s burnout timeline, Felps’s contagion effect, and the turnover-performance curve gives us enough to build an explicit model. It’s worth being upfront: this model is my own construction, calibrated against real published ranges, not a number lifted from any single study. No one has run the exact experiment of measuring “point of no return” in technical debt terms. But the mechanism is real, and a transparent model can be valuable.
The burnout-to-contagion timeline
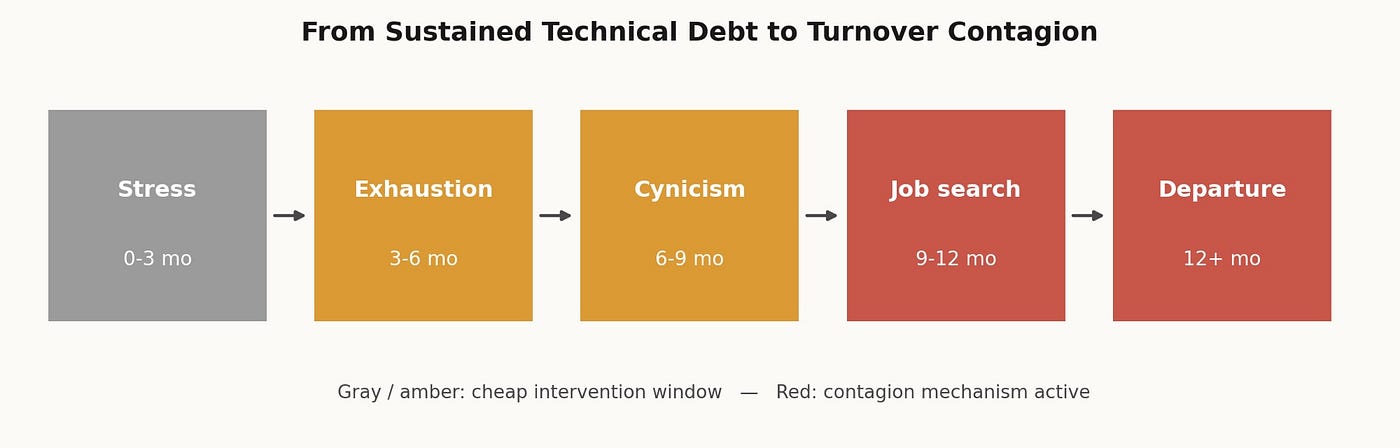
Mapping Maslach’s stages onto months of sustained, un-decreasing technical debt gives a rough but useful sequence: chronic stress in the first three months, emotional exhaustion from month three to six, cynicism from six to nine, active job search from nine to twelve, and departure, with the contagion effect switching on, past the twelve-month mark. The zone before cynicism sets in (roughly the first six months) is the cheap window: dissatisfaction exists, but no one has started actively looking yet, so Felps’s contagion mechanism hasn’t been triggered. Past that window, the team isn’t just unhappy, it’s primed to lose people in clusters, not individually.
The snowball itself
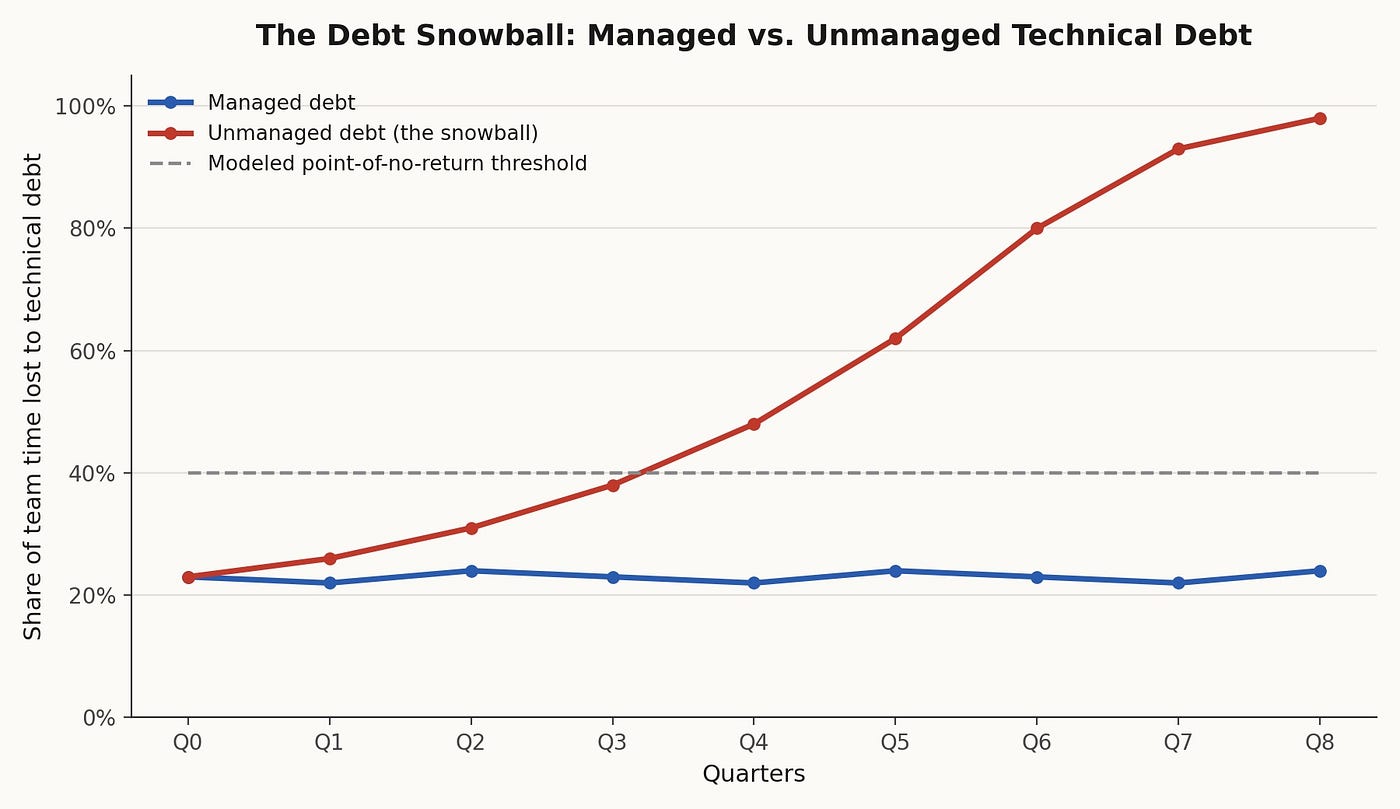
Every departure removes not just a person but the tacit knowledge that person carried about why the system is built the way it is. The remaining team has to work around that gap, which is itself new technical debt — debt that was created by an empty seat. That new debt further erodes morale for whoever’s left, which raises the odds of the next departure. This is a textbook positive feedback loop. As long as the debt a departure creates is smaller than what the team can pay down before the next one leaves, the system is self-correcting. The point of no return, formally, is the moment when the loop’s own gain crosses one, and it starts running on its own momentum, independent of whatever caused the original debt.
A workable pair of indicators:
- Leading indicator: number of consecutive months where the share of sprint time lost to debt has not decreased. Six months lines up with the exhaustion-to-cynicism transition in the burnout model, it’s the point where “annoyed” starts turning into “looking.”
- Lagging/confirming indicator: a cluster of people simultaneously showing active job-search behavior, rather than one person leaving in isolation. A single departure is normal turnover. A cluster is the contagion mechanism already running.
What it costs, either way
Take an illustrative team: eight engineers, average salary $130,000, an 18-month horizon. Two paths:
Managed debt
The team spends roughly the researched average, around 20 — 23% of capacity servicing debt on an ongoing basis. That’s an opportunity cost, roughly $312,000 in slower delivery over 18 months, plus the unavoidable baseline churn every company has (software’s industry-average annual turnover sits around 13%), adding about $260,000 in ordinary replacement costs. Total: roughly $572,000 — a known, budgeted number.
Crossing the threshold
Debt-servicing time climbs toward 40 — 60% before the collapse becomes visible, pushing the opportunity cost to roughly $702,000. Accelerated, contagion-driven attrition, say half the team leaving within 18 months, since the people with the most job offers tend to be the ones who act on their frustration first, adds replacement costs of about $650,000 at the standard 100 — 150%-of-salary range. Ramp-up time for the replacements, at reduced productivity for three to six months each, adds roughly another $108,000. Total: roughly $1.46 million — and that’s before accounting for the one cost that can’t be priced at all: the system knowledge that left with the people who understood it.

The difference of crossing the threshold costs about 2.5 times more than staying ahead of it. That ratio is conservative, since it doesn’t include the compounding delay to the roadmap while a rebuilt team relearns a system nobody currently understands.
Takeaways
For engineers: the burnout stages aren’t just something to notice in hindsight. If the debt-servicing share of your sprints hasn’t gone down in six months, that’s a measurable, well-documented point where exhaustion typically becomes cynicism, and cynicism is the stage right before people start quietly job-hunting. That’s useful information to raise with management before it’s a resignation letter, because at that point the fix is still cheap.
For managers and leadership: the moment a single voluntary departure is clearly tied to debt-driven frustration is a triggering event. The economically rational response is to temporarily raise the share of capacity spent paying down debt (from a normal ~20% toward 40 — 50% for a quarter or two), even at the cost of feature velocity, because the curvilinear turnover-performance research and the contagion mechanism both say the same thing: the cost of waiting doesn’t stay flat, it accelerates. A dollar spent on debt before the threshold is worth roughly two and a half times more than a dollar spent rebuilding the team after it.
The hidden mechanic: the retention conversation defaults to compensation and culture because those are visible, nameable, easy to survey. Technical debt is discussed constantly, but almost always as an efficiency problem, never as the top-ranked source of developer frustration that it actually is, and never as the slow-burning fuel behind a fast collapse. The fire in Mann Gulch looked routine for hours. It stopped being routine in about ten minutes.
메타데이터
- post_id
- fe6b1577c341
- slug
- the-point-of-no-return-how-technical-debt-predicts-engineering-attrition-fe6b1577c341
- url
- https://medium.com/techtrends-digest/the-point-of-no-return-how-technical-debt-predicts-engineering-attrition-fe6b1577c341
- canonical_url
- https://medium.com/techtrends-digest/the-point-of-no-return-how-technical-debt-predicts-engineering-attrition-fe6b1577c341
- author_url
- https://medium.com/@sevastianov
- status
- ok
- fetched_at
- 2026-07-09 17:36:58