1847 Wind and Current Charts
Excerpt from I Maury.
1847 Wind and Current Charts
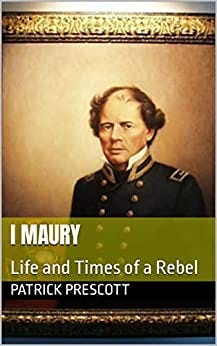
Fictional Autobiography
Excerpt from I Maury.
Chapter 10
Wind and Current Charts
Five years after I took over the Depot of Charts and Instruments and began the systematic study of a hundred years of logbooks, “we,” this was a team effort, I did not accomplish these charts alone, began producing new kinds of charts. Lieutenant William B. Whiting, fellow officer on the Falmouth, was our draftsman.

Wind and current chart of the Atlantic
We began producing results in early 1847. The charts were an unprecedented success. They underlined the temperature of the water, used arrows to denote currents and the length of arrow showed the strength in knots. Roman numerals denoted the degree of magnetic variation recorded; the colors represented the seasons in which a vessel had sailed.
We took raw data and made it meaningful! Using records of hundreds of voyages, we discovered pathways through dangerous seas, quickened trade, and increased safety.
We noticed from all the logs that the tradition of sea captains when going down to Rio took a zig zag path. Computing this path, we calculated that they sailed the distance of crossing the Atlantic three times. They feared the winds and currents around St. Rogue and the bulge of South America was dangerous due to the prevailing trade winds which were from the southeast.
We discovered the inshore current provided favorable winds for ships that kept close to land. This route was named, “Fair Way to Rio.” It needed to be tested.
A daring merchant captain, John J. Jackson agreed to sail from Baltimore to Rio on the bark, W.H.D.C Wright. I instructed him to hug Cape St. Rogue, “Stand boldly on and if need be, tack and work under the land.”
The usual time for sailing this route was fifty-five days, Jackson unloaded his cargo in Rio taking only thirty-eight days. He sailed into Boston Harbor 35 days before she was expected. The Baltimore American on 18 May reported the achievement. Word spread to Philadelphia, New York, and Boston.
The coffee houses talked of what this meant for sailing to Rio. Every day less spent at sea lessened the chances of danger from storms and pirates. Five thousand of the charts were distributed and the demand only increased.
We created a 10-page “Abstract Log for the Use of American Navigators.” The pamphlet interpreted the meaning of the Wind and Current Charts and supplied 12 different blank forms, which were to be filled in by navigators using the charts. The completed Abstract Logs were to be returned to the Naval Observatory at the end the voyage. The information was then tabulated for future use.
We were able to accomplish all of this because of the full backing of my superiors. For which I and all those who worked and are working at the observatory are eternally grateful.
I offered a Wind and Current Chart of the North Atlantic free of charge to any navigator who promised to make the observations, record, and return them.
At The American Association for the Advancement of Science in September of 1848, I unveiled a plan to expand the collection of data to vessels of all nations, because the work, “is not exclusively for the benefit of any nation.”
Merchants like Robert Bennet Forbes and fellow scientists from the new association endorsed my proposal to congress. Three ships were authorized for research, but only one was allocated funds. The Taney became the Navy’s first oceanographic ship which started the program.
We printed six series of charts lettered A through F. I wrote, Sailing Directions, essays that accompanied the charts. This series of essays told the captains and navigators that the charts “are derived from the results of many thousands of navigators.”
When examining the logs of ships now required to send in the charts, we found not to our surprise that many of the older captains stuck to the old path and spurned the Wind and Current charts. I found that I could know the character of a ship’s captain by the track at sea. “A crazy fellow always makes a crooked path.”
The proud British were slow to accept my new charts and continued to use theirs. I wrote a friend, that their ships packets from New York to Liverpool and Le Havre,
“all keep too far south on both voyages. I want tracks of results in all parts of the Atlantic and Pacific. I want those vessels especially in Canada, New Orleans and North of Europe trade. Pray ask Lord Wrottesley (a member of the House of Lords), to lend me a hand with English ship owners.”
Lord Wrottesley on 18 April 1853 gave this speech in the House of Lords, “It is time that I should now explain how these charts are constructed, and routes discovered. The whole ocean is divided into squares, the sides represent 50 of longitude and 50 of latitude; in the midst of these squares the figure of compass points, the intermediate points being omitted; the logbooks are then searched for observations of the directions of the winds and of the proportion of the calms in each squares; in the center of each compass so drawn are placed two numbers, one representing the total number of observations obtained in the square, the other the percentage of calm days.” He concluded by saying. “When the twelve compasses have been delineated and filled up, they are combined by a peculiar, neat arrangement of the numbers within concentric circles, into one, and a chart of the ocean, containing these combinations, is termed a pilot chart. Others in Europe praised the Wind and Currents Charts, saying that I had changed navigation away from the standard of “b’ guess and b’ God.”
With the publication of the Wind and Currents Charts speeding up travel and making sailing safer two major developments happened. First was a new type of sailing vessel known as the “clipper.” It became known as the “Greyhound of the Seas.” With the Wind and Current Charts, they could sail from New York to Hong Kong without having to refuel for coal like a steamship. Without using half of the hold for coal they were more streamlined and could carry more cargo. The second was the discovery of gold in California. News of gold at Sutters Mill near Sacramento reached Hawaii, Sonora, Chile, Peru, China, and Australia. Caught off guard as my focus was on the charts, I considered the newly acquired territory as a low priority. Now it was very important.
We researched for information on which ports would be best for the Navy. San Diego, Los Angeles, and Monterey were possibilities, but gold was found closer to San Francisco. Within a year San Fransico was a forest of sailing masts and deserted ships.
By 1851, three years after gold was discovered in California, I had a feeling of accomplishment. 1,400 ships sailed around Cape Horn to California, and many came back laden with gold by the same route. Those who used the Wind and Currents Charts, with up-to-date instruments for longitude and latitude made good time on safer voyages. It is hard to imagine the carnage that would have resulted without them. The change in sailing on the seas forever is the reason for fewer ships lost, time shortened, and lives saved.
The average sailing time between New York and San Francisco before the charts was 188 days. With the charts it was 40 days quicker. Clippers made it much faster. In 1851 Captain Josiah P. Cressey in the Flying Cloud made the 374 nautical miles in 89 days and 21 hours. This set off a frenzy of clippers racing each other and giving much enjoyment to those of us at the Observatory as it reinforced the effectiveness of our charts.
Another run by the clipper Sovereign of the Seas sailed from Hawaii to New York in 82 days. The captain reported on one day they sailed 374 knots (4331/4 miles).
When the British adopted my charts, at the insistence of their underwriters, it shorted their voyage time to Australia and New Zealand by one fifth, and a savings of 1,300 pounds sterling per 1,000-ton ship on each vessel and voyage.
They saved $100,000 to $200,000 annually on their trips to Bombay. By 1855 the underwriters found each year they saved ten million dollars.
American underwriters estimated that they saved $2,250,000 on freight shipped to South America, China, and the East Indies a year, not counting other routes.
As data started tracking in, we created better routes between Australia and New Zealand with Great Britain. We started receiving lots of steamers moving from Australia to Panama. Britain’s Navigation Acts were gone, and this opened an opportunity for the United States to grab some of the bullion — carrying trade. I plotted a course around Cape Horn using the fierce westerlies close to Antarctica to cut a thousand miles off the Great Britain to Melbourne route and extend it to the China trade and the Indies.
As the data arrived from all maritime nations over the world, we made additions and if the data we had on hand was off then they were deleted. By 1859 our charts and currents were divided into two volumes.
메타데이터
- post_id
- ff468cb4da8c
- slug
- 1847-wind-and-current-charts-ff468cb4da8c
- url
- https://medium.com/@patrickprescott_75079/1847-wind-and-current-charts-ff468cb4da8c
- canonical_url
- https://medium.com/@patrickprescott_75079/1847-wind-and-current-charts-ff468cb4da8c
- author_url
- https://medium.com/@patrickprescott_75079
- status
- ok
- fetched_at
- 2026-07-30 02:06:40