Architecting for Reliability: Simulating “Invisible CPU Debt” in AWS
Hi everyone! It was a productive start to 2026 advocating for a shift in how we monitor and manage cloud architectural risks.
Architecting for Reliability: Simulating “Invisible CPU Debt” in AWS
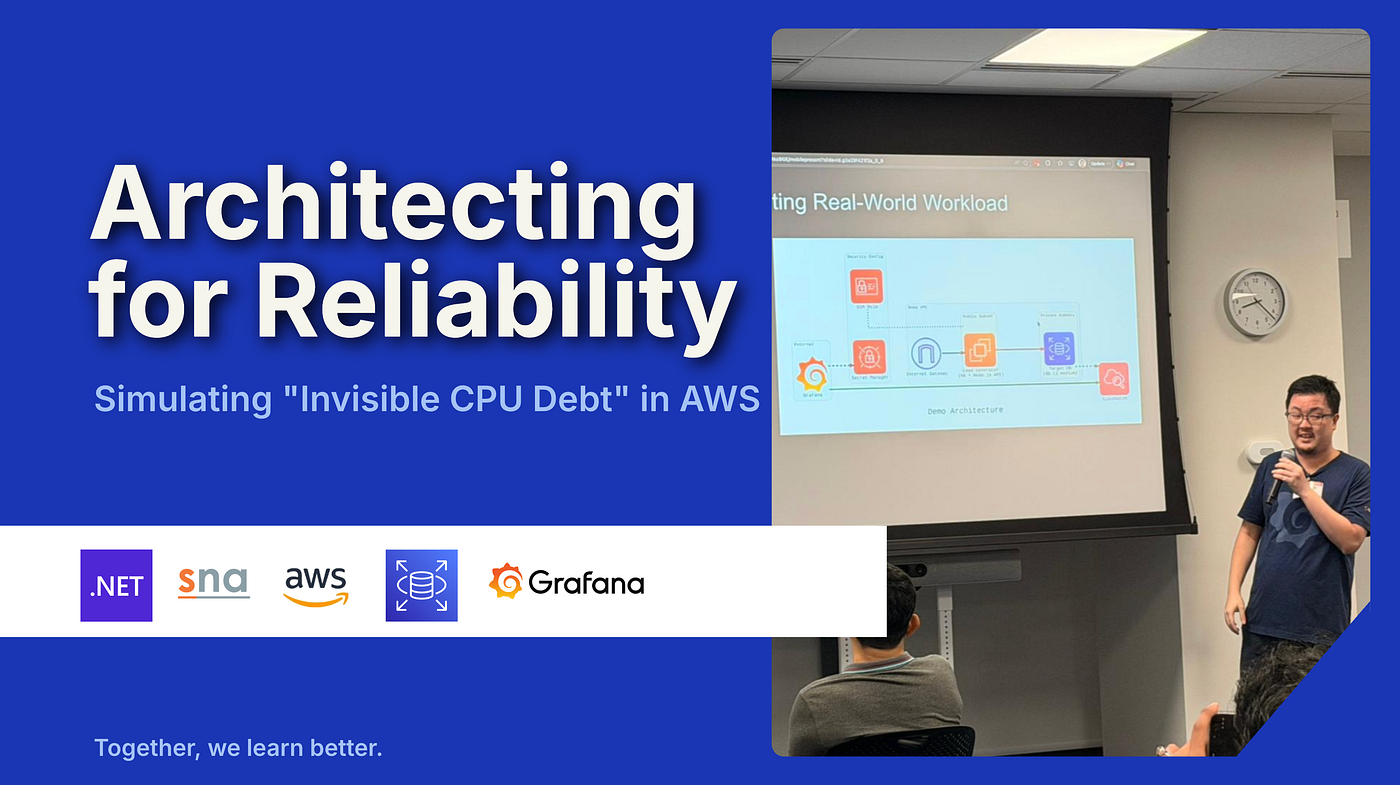
Hi everyone! It was a productive start to 2026 advocating for a shift in how we monitor and manage cloud architectural risks.
I recently joined the AWS User Group Singapore meetup at the AWS Singapore Office to address a critical vulnerability in modern cloud architecture: Invisible surplus credit charges in burstable instances.
Modelling AWS RDS T3 as a token bucket using discrete event simulation. (Image Credit: AWS User Group Singapore)
The Risk of T3 CPU Surplus Credit Consumption
Most engineers monitor “CPU Usage”. However, for T3 and T4g instances in Amazon RDS unlimited mode, usage is only a proxy for the real cost driver: Surplus CPU credit consumption. This is what I call “Invisible CPU Debt”.
When your credits hit zero in RDS unlimited mode, which is the default mode, AWS automatically provides surplus credits and **bills you for them. Standard observability dashboards show CPU usage but fail to predict these invisible cost overruns**. You think you are running efficiently, but you are actually accumulating unexpected charges.
About Malaysia AWS Region: ap-southeast-5
During our session, we discussed the new ap-southeast-5 Malaysia region. To clarify: Graviton3 is available in Malaysia region, which provides Singapore-based firms with a compelling multi-region option: Close enough for sub-5ms disaster recovery replication, yet geographically separated, all while leveraging ARM architecture efficiency.

AWS Malaysia ap-southeast-5 region. (Image Credit: Weiyuan)
An audience member asked whether my simulation needs to model T3 (Intel) and T4g (Graviton) differently. Great question! The answer is no because both utilise the same underlying burstable credit model with identical earning rules (for example, both t3.medium and t4g.medium earn 24 credits/hour, as shown in the AWS Elastic Compute Cloud (EC2) User Guide). However, superior performance-per-watt of Graviton means you get more work done per credit consumed.

T3 and T4g both have the same CPU credits earning rate. (Source: AWS EC2 User Guide)
Researching Architectural Risks with Discrete Event Simulation (DES)
To move beyond the guesswork of standard monitoring, I modelled the RDS burstable CPU credit system using DES via my open-source library **SNA**. The credit mechanism itself follows deterministic rules, but the simulation models real-world workload variability stochastically. This allows us to quantify risk before it manifests in production.
The modelling is not based on guesswork. In fact, I map these simulations directly from official source data. For example, the t3.medium earnings rate (24 credits/hour) is a fixed constraint in the engine in SNA.
With this foundation, DES becomes a powerful predictive tool. Standard monitoring tells you what happened but DES tells you what it will cost. It handles the nuances of request timing and credit consumption better than a simple spreadsheet. By codifying burstable behaviour in AWS (see AwsRdsBehavior.cs in the repo), we move from reactive billing surprises to predictive cost architecture.
Here is a part of the code that I used to simulate the credit-burn state changes:
// 1. Earn Credits
if (IsBurstable && timeDelta > 0)
{
    double earned = timeDelta * EarnRatePerSec;
    _credits = Math.Min(MaxCredits, _credits + earned);
    _lastUpdateTime = now;
}

// 2. Burn Logic (Look Ahead)
double estimatedBurstCost = spec.FastSecs * BurnRatePerSec;
bool isThrottled = IsBurstable && _credits < estimatedBurstCost;

// 3. Determine Service Time
double baseTime = isThrottled && !isUnlimited ? spec.SlowSecs : spec.FastSecs;
double actualDuration = -baseTime * Math.Log(1.0 - rnd.NextDouble());

// 4. Pay the Bill
if (IsBurstable)
{
    double actualBurn = actualDuration * BurnRatePerSec;
    _credits = Math.Max(0, _credits - actualBurn);
}
As shown in the third step in the code above, we use exponential distribution sampling to model stochastic service times, which is a standard technique in discrete event simulation.
In addition, even though real database query times often follow log-normal or other distributions with higher variance, exponential is a reasonable starting approximation. Modelling it with exponential distribution provides a conservative baseline which provides reasonable first-order estimates and it can be refined with real production data for SMEs and teams without dedicated SREs.
In our code, baseTime is the mean service time, aka average time per second, which is 1/λ, where λ is the rate (events per unit time). Thus, to generate a random sample based on the exponential distribution for the actualDuration, our code uses the inverse CDF (quantile function) to transform uniform random numbers generated by .NET Random.NextDouble() into exponentially distributed actualDurations.

The quantile function (inverse CDF) for exponential distribution. (Image Source: Wikipedia)
By running the code above with SNA, we can predict exactly when surplus credit charges will kick in and estimate the monthly cost impact.

The simulation result for AWS t3.medium.
From “Deploy and See” to “Model and Predict”
One might argue that using DES to model a CPU bucket is like using a nuclear weapon to kill a fly. Why not just use a spreadsheet?
For many SMEs and small teams, burstable instances (T3/T4g) are the bread and butter of their infrastructure. While a spreadsheet can calculate average usage, it cannot predict the cost implications of bursty workloads.
Simulating these scenarios is not about being academic. In fact, it is about Cost Predictability. It allows small teams without a dedicated FinOps analyst to identify exactly when a $20/month instance will start incurring surplus credit charges before the bill arrives.
By packaging this expertise into the SNA engine, we transform a complex architectural risk into a predictable, manageable metric.
Getting Insights from Grafana Dashboard
A few days later after my sharing in AWS User Group, I was consulting on the future of observability with Hisham Bin Ateya (Microsoft MVP and Orchard Core Enthusiast) on his podcast.

The 3rd episode of Hisham’s TechTalk podcast titled “Grafana: Getting Insights from Metrics & Dashboard” (Image Source: YouTube)
Discussing the Three Pillars of Observability, i.e. Logs, Metrics, and Traces, highlighted a common industry failure: Observability without Actionability. Most organisations suffer from information overload, where they have data but lack insights.
The bridge between my AWS talk and our observability discussion is this: Simulation provides the “What-If,” while Grafana provides the “What-Now”.
By feeding SNA data into Grafana, we can also move beyond just looking at what happened in the past. Instead of showing 50 different charts that lead to confusion, a high-value dashboard should turn raw metrics into a Time-to-Failure countdown.
This is the difference between a dashboard you just watch and a dashboard you actually use to ensure system reliability.

Monitoring CPU credit balance and surplus credit balance on Grafana.
Final Thoughts
Architecting for reliability and cost-efficiency requires more than just making charts. In fact, it requires a deep understanding of the underlying resource models and their financial implications. Whether at a meetup or in a podcast session, my goal is to help organisations build resilient, predictable, and cost-optimised environments.
If you want to try the simulation, you can find the code in my SNA GitHub repository under the AwsRdsSample folder.
Thank you for reading, and let’s keep building more reliable systems together!
메타데이터
- post_id
- ffc4656bd31a
- slug
- architecting-for-reliability-simulating-invisible-cpu-debt-in-aws-ffc4656bd31a
- url
- https://medium.com/@goh_chunlin/architecting-for-reliability-simulating-invisible-cpu-debt-in-aws-ffc4656bd31a
- canonical_url
- https://medium.com/@goh_chunlin/architecting-for-reliability-simulating-invisible-cpu-debt-in-aws-ffc4656bd31a
- author_url
- https://medium.com/@goh_chunlin
- status
- ok
- fetched_at
- 2026-07-27 14:41:33






