Careem Business Operations Dashboard | Power BI
Project Scope
Careem Business Operations Dashboard | Power BI
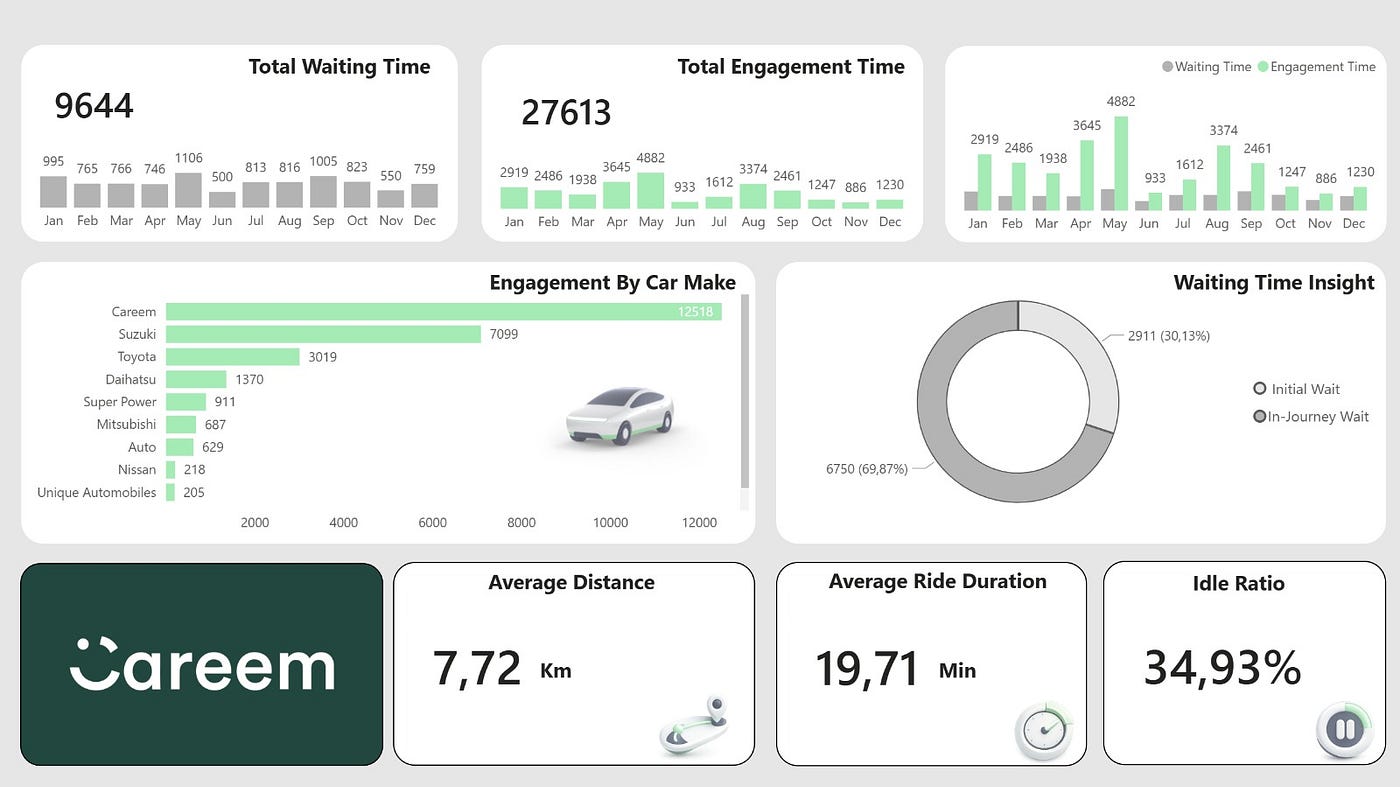
Link to the Dashboard
Project Scope
Understanding how time is spent across operations is essential for making better business decisions. In mobility and transport environments, engagement time is more than just an activity metric — it reflects how effectively resources are being used, how consistently demand is being served, and where operational inefficiencies may be affecting performance. Measuring engagement level helps move the discussion beyond simple trip counts or duration totals and toward a more meaningful view of productivity, responsiveness, and asset utilisation.
This dashboard was developed to explore engagement and waiting patterns within ride operations, with particular attention to how vehicles and working time are distributed across the business. By tracking total engagement time, total waiting time, ride duration, distance, and idle ratio, the analysis provides a clearer picture of how operational time is divided between value-generating activity and non-productive intervals. This makes it possible to identify whether resources are being fully utilised, where delays may be building up, and which areas may require operational adjustment.
Dataset description
This project uses the **Careem/Uber rides user dataset** sourced from Kaggle. The dataset contains ride-level records focused on user trip activity and is intended for analysing patterns and relationships within ride-hailing operations.
In practical terms, the data supports analysis of operational metrics such as engagement time, waiting time, ride duration, distance, and idle behaviour, making it suitable for evaluating how time is distributed between productive and non-productive activity. It can also be used to compare performance across categories such as month and car make, which is why it works well as the foundation for this dashboard.
Dashboard Overview
This Dasboard focuses on assessing engagement time against waiting time to understand how effectively operational time is being used. The core idea is to separate activity into useful action and non-useful time. Engagement time represents productive, value-adding activity where drivers are actively involved in service delivery. Waiting time, by contrast, reflects idle or less productive periods that may signal operational inefficiencies, demand imbalance, or scheduling gaps. By comparing these two dimensions across months, vehicle types, and trip patterns, the dashboard helps identify where time is being converted into meaningful operational output and where improvements can be made to increase efficiency, utilisation, and service performance.
Engagement Time

Engagement time is one of the most important measures in ride-hailing and mobility operations because it reflects the share of time spent on value-creating activity. In this context, it represents the period when vehicles and drivers are actively contributing to service delivery rather than remaining unproductive. Unlike raw trip counts alone, engagement time gives a clearer view of operational intensity, resource utilisation, and how effectively available capacity is being converted into actual service.
Tracking engagement time can reveal patterns that are not immediately visible through volume-based metrics. It helps identify whether high activity levels are truly efficient, whether certain months or vehicle groups generate stronger productive use, and whether long periods of waiting are reducing operational performance. When compared with waiting time, distance, and ride duration, engagement time becomes a powerful indicator of how well the system balances demand, driver allocation, and fleet productivity. For this reason, it serves as a strong starting point for the dashboard, framing the broader analysis around useful action, idle time, and opportunities for operational improvement.

Waiting Time

Waiting time is the natural counterbalance to engagement time and is equally important in understanding operational performance within ride-hailing services. While engagement time reflects useful, service-delivering activity, waiting time captures periods where that value creation is paused or delayed. On its own, waiting time is not always negative, as some level of waiting is unavoidable in transport operations. However, when it becomes excessive or unevenly distributed, it can point to inefficiencies in demand matching, pickup flow, traffic conditions, routing, or service allocation.
To better understand its drivers, waiting time can be separated into two distinct stages. Initial wait refers to the period before the journey meaningfully begins, often influenced by dispatch efficiency, driver proximity, pickup coordination, or customer readiness. In-journey wait, by contrast, reflects delays that occur during the trip itself, such as congestion, stops, route interruptions, or operational friction along the way. This distinction matters because each type of waiting suggests a different operational issue and therefore a different area for improvement.

Assessing engagement time and waiting time in the same view creates a more complete picture of performance. Rather than looking only at how much activity is taking place, the dashboard also shows how much time is being lost, delayed, or underutilised. Together, these measures help evaluate the balance between productive service delivery and operational friction, making it easier to identify where efficiency can be strengthened.

Idle Ratio
These time components ultimately feed into the Idle Ratio, which gives the analysis practical actionability by translating multiple operational behaviours into one clear value to track. By combining waiting time against productive engagement time, the metric offers a focused indicator of inefficiency, making it easier to monitor performance, compare periods, and identify where corrective action may be needed.

The Idle Ratio was calculated in Power BI using a DAX measure that divides total waiting time by total engagement time. In practical terms, this means summing all recorded wait time minutes and comparing them against the total engagement time across the selected data context. This approach allows the metric to respond dynamically to filters such as month, location, or other operational dimensions, making it a useful indicator of how much non-productive time exists relative to active engagement.

Tools & Skills Used
- Power BI for dashboard development, interactive reporting, and visual storytelling
- DAX for calculated measures, KPI logic, and dynamic metric creation such as Idle Ratio
- Statistical analysis for identifying patterns, relationships, and performance trends within the dataset
- Business analysis for translating ride activity data into meaningful operational insights
- Data modelling for structuring the dataset in a way that supports accurate reporting and filtering
- Data cleaning and preparation to improve consistency, usability, and analytical quality
- KPI design for building practical measures around engagement time, waiting time, and idle performance
Conclusion
This dashboard demonstrates how operational data can be transformed into meaningful performance insight through Power BI. By assessing engagement time, waiting time, and Idle Ratio together, the analysis moves beyond simple activity tracking and toward practical decision support. The result is a clearer view of efficiency, service flow, and unproductive time, helping turn raw ride data into actionable business understanding.
메타데이터
- post_id
- ffd255ea2cce
- slug
- careem-business-operations-dashboard-power-bi-ffd255ea2cce
- url
- https://medium.com/@ostrovetschii/careem-business-operations-dashboard-power-bi-ffd255ea2cce
- canonical_url
- https://medium.com/@ostrovetschii/careem-business-operations-dashboard-power-bi-ffd255ea2cce
- author_url
- https://medium.com/@ostrovetschii
- status
- ok
- fetched_at
- 2026-07-11 23:42:18




