SonarQube Catches Bugs in Code. Sentry Catches Bugs at Runtime. Turns Out One Isn’t Enough.
A practical guide to building layered quality assurance in software engineering — based on real experience shipping MediScribe, a clinical…
SonarQube Catches Bugs in Code. Sentry Catches Bugs at Runtime. Turns Out One Isn’t Enough.
A practical guide to building layered quality assurance in software engineering — based on real experience shipping MediScribe, a clinical AI transcription platform for doctors.
There’s a situation that happens in almost every software team, at some point, without fail.
Pipeline green. Code review approved. SonarQube reports no issues. Coverage 100%. Every check passes. Merge to staging. Deploy successful.
Then someone opens the app — and something’s wrong. Not a crash. Not an error page. Just a feature that quietly stopped working. Data that should appear, doesn’t. And nobody knows why, because every quality indicator says everything is fine.
This isn’t a pipeline failure. It’s the limit of what static analysis can do — and a signal that there’s a monitoring layer missing.
We ran into this exact situation building MediScribe — a desktop application that helps doctors automatically generate SOAP notes, ICD-10 diagnostic codes, and prescriptions from consultation recordings. The app is installed directly on doctors’ computers as a .exe file, used mid-consultation, with real patients in front of them. When something fails silently here, doctors don't get an error message. They just see a blank screen and don't know what to do next.
This article is about how we built two complementary quality assurance layers: SonarQube to protect code quality before it reaches staging, and Sentry to monitor app behavior after it’s running. Not one or the other. Both — because they answer different questions.
It Started with LogRocket
At the beginning of the semester, MediScribe’s monitoring tool of choice was LogRocket. And in the early stages of frontend development, it was genuinely useful.
LogRocket is a session recording tool — it captures everything a user does in the browser: clicks, scrolls, inputs, network requests, console errors. All of it replayable like a video. While we were actively building frontend components and debugging UI interactions, being able to replay what happened in a specific session made identifying problems much faster.
But there came a point where it stopped fitting the actual context.
MediScribe isn’t a web app accessed through a public URL. It’s a local desktop application — downloaded, installed, and run on the doctor’s own computer. It’s distributed as a .exe file packaged with Inno Setup, built and released automatically through an Azure DevOps pipeline. Doctors install it like any other software, double-click, app opens. LogRocket is built for web products with thousands of users across different locations — where session recording helps understand usage patterns at scale. For a local app running on one doctor's computer in one clinic, that model doesn't fit.
And there’s a more fundamental problem: LogRocket sends session data to an external server. For MediScribe, which processes doctor-patient consultation recordings and clinical notes, sending session data to a third-party service is a real privacy concern — even if what’s being sent is only interaction events, not the medical content itself.
So LogRocket remained as a relic of the early phase, but it was no longer the right monitoring solution for an app that had become an installer.
Why Sentry?
From LogRocket, the next question was clear: if not session recording, what kind of monitoring actually fits here?
What was needed wasn’t a screen recorder. It was something that worked at the backend level — that could catch exceptions at runtime, record their context automatically, and surface them without anyone having to look manually. Not a generic “server error” notification, but enough information to debug immediately: which database query was running, which user was affected, which endpoint failed, and the sequence of events leading up to the crash.
Sentry fits precisely there. For Django specifically, DjangoIntegration handles almost all instrumentation automatically — every request, every exception, every database query gets recorded without writing a single line of manual instrumentation code. And setup is genuinely simple: register a project on sentry.io, copy the DSN, add one line to .env, restart the server. Sentry is live and watching.
What wasn’t expected: the moment it was active and the app was run, two errors appeared in the dashboard immediately — without anyone deliberately looking for them, without manually triggering anything, without reproducing any specific scenario. Sentry found something that wasn’t in the test suite and would never have shown up in a SonarQube report.
That’s the most tangible difference between static analysis and behavioral monitoring — SonarQube needs to be asked. Sentry just tells you.
SonarQube: The Quality Gate Before Code Gets In
SonarQube is integrated with the Azure DevOps pipeline as a quality gate — every pull request is blocked from merging to staging if the pipeline fails. Not a warning. A hard block.
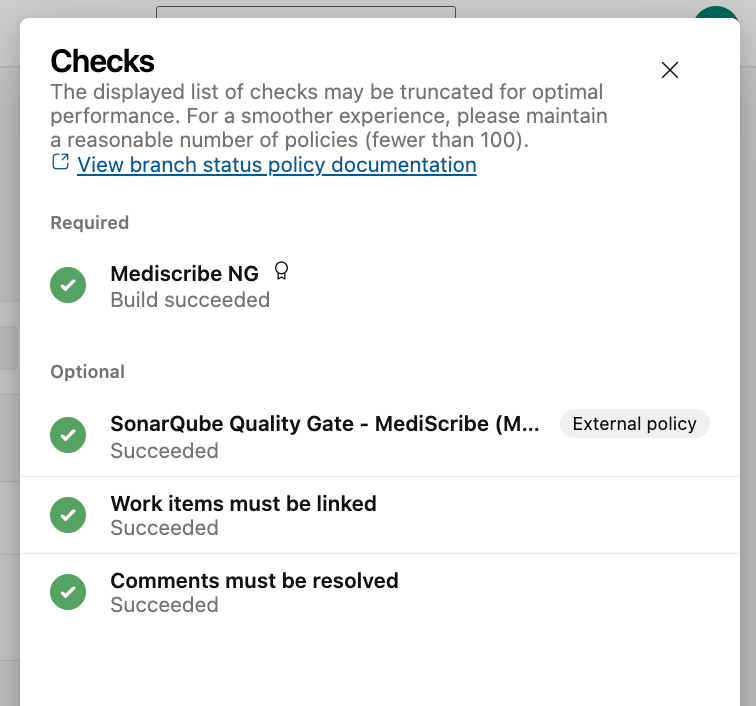
The pipeline runs automatically on every push: install dependencies, run Pytest with coverage, run Jest with coverage, run SonarScanner via Docker. If any stage fails, the merge is blocked. On the PR side, three conditions must all be green before merging is possible — build succeeded, SonarQube Quality Gate passed, and work items must be linked. All checked automatically, nothing bypassable.

Two conditions must be met in SonarQube before any merge: coverage on new code at 100%, and new issues at zero. Not aspirational targets — hard requirements enforced by the pipeline.
There were sprints where quality gate failures had to be resolved before code could go in. Two concrete examples:
First iteration — SonarQube flagged the use of an Array for an existence check that should have been a Set. Not a bug that causes a crash, but the includes operation on an Array is O(n) — it checks every element one by one. A Set uses hash lookup: O(1), constant time. For a validation that runs every time a user selects an audio file, that difference is real. SonarQube also flagged && chaining that should have been optional chaining — cleaner, more defensive, more idiomatic modern JavaScript. Two small issues that would never become a filed bug report, but quietly degrade code quality if left unchecked.
Second iteration — SonarQube detected high cognitive complexity in one function, with a score of 18 exceeding the allowed threshold of 15. Cognitive complexity isn’t just line count — it measures how many logical branches a reader has to track simultaneously. Functions with high complexity are hard to test, easy to misread, and tend to become hiding spots for unexpected bugs. The fix was straightforward: extract two helper functions, complexity drops from 18 to 3.

That’s what SonarQube does well — ensuring code that enters the shared branch has already met a quality standard, automatically, every time, without depending on individual discipline.
The Limit Static Analysis Can’t Cross
SonarQube analyzes static code — the text you wrote. It can’t execute that code. And that’s where its boundary becomes real.
Expired authentication tokens, stale cache, sessions that have run out — all of these only surface when the app is actually running and talking to other systems. If an external server returns a 401 or times out, SonarQube has no idea. The code might be perfectly written. The error handling might follow every best practice. But the runtime failure goes unrecorded — until someone reports it manually.
For MediScribe, this isn’t a theoretical concern. The app is used by doctors in real clinical situations: a consultation in progress, patients waiting, notes that need to be done before the next patient comes in. If an EMR integration fails silently, the doctor sees a blank screen — and there’s no error message explaining why.
Sentry: Two Errors That Would Never Show Up in SonarQube
Sentry works at a different layer — not in the code, but at runtime. It lives inside the running app, watching what happens. Every incoming request, every exception, every database query — all recorded with full context.
The moment the app was first run with Sentry active, two errors appeared in the dashboard without anyone deliberately looking for them.

First error — ZeroDivisionError could theoretically have been caught by static analysis, but because this endpoint only exists in debug mode and wasn't covered by the test suite, SonarQube never saw it. What Sentry provided wasn't just "there's an exception in this file" — it was a full stack trace down to the exact line, breadcrumbs recording the sequence of events before the crash, the context of the logged-in user, and the SQL query that was running when the exception was thrown. Enough information to know exactly what to fix, without needing to reproduce anything from scratch.


Second error — HTTPError 401 from Almira EMR — this is the one SonarQube couldn't catch at all.
The code was correct. Sentry even flagged it as handled: true because the exception was properly handled by the code. The problem wasn't in the code — it was in runtime state: the authentication session to Almira had expired, and the request for today's patient list failed mid-flight.


Sentry showed the failing endpoint, the responsible module, the affected user, and breadcrumbs — a full timeline from the database query to the HTTP call to Almira to the exception. Without Sentry, this error would only surface when a doctor complained that their patient queue was empty. With Sentry, the moment it happens there’s a ticket ready to debug — no reproduction needed, no guesswork.


Monitoring That Knows Its Own Limits
There’s something more important than “is Sentry active”: what is Sentry allowed to send.
MediScribe is a clinical application. Every session contains sensitive data — doctor-patient conversation recordings, consultation transcripts, SOAP notes. Sending all of that to a third-party monitoring service isn’t just unnecessary — it potentially violates patient privacy. This is a trade-off that has to be thought through before enabling any monitoring in a medical system.
That’s why there’s a before_send function that runs before every event is sent to Sentry. Fields containing medical data — transcription, soap_note, notes — are automatically replaced with [FILTERED_MEDICAL_DATA] before leaving the server. The stack trace stays complete. The error message stays intact. But the clinical content never leaves the machine.

This is also visible in the HTTPError detail from earlier — the Authorization field in the request headers is already marked [Filtered]. DjangoIntegration defaults to scrubbing authorization headers, and the custom before_send adds a second layer for medical-specific data. Two protections working in parallel without needing to be reconfigured every time a new field appears.
One more intentional condition: when running locally in debug mode, before_send blocks all event transmission entirely. Errors get resolved locally, not shipped to the dashboard. Sentry only receives events from staging and production — environments where real data might actually be present.
Monitoring that’s useful in a clinical context is monitoring that knows its own limits.
Two Layers, One Pipeline
What emerged from all of this isn’t two tools running independently — it’s one QA system that covers different points in the development lifecycle.
SonarQube is preventive. It stands at the entrance to staging, blocking code that doesn’t meet the standard before it can touch the shared branch. Code smells, high complexity, insufficient coverage — all caught before anyone else is affected.
Sentry is detective. It stands on the other side — after deploy, once the app is in the hands of real users. It can’t prevent bad code from getting in, but it ensures runtime failures don’t go silently undetected.
The two answer different questions at different points: SonarQube works before the merge, Sentry works after the deploy. The gap between them is where problems hide when only one exists.
What Neither Can Guarantee
This article wouldn’t be honest if it only showed what worked.
SonarQube can’t catch logic errors that slip through test coverage — if the tests are wrong, the analysis can’t be right either. Sentry can’t prevent problems, only report them after they happen. And neither has visibility into things that aren’t instrumented: query performance under production-scale data, bottlenecks in the AI transcription pipeline processing long audio files, or user behavior that doesn’t produce an exception at all.
For MediScribe going forward, there are gaps to fill — particularly around performance monitoring for AI workflows that can take tens of seconds. Sentry performance tracing is already enabled, but the data collected from development isn’t yet enough for meaningful analysis.
But that’s the point: quality assurance isn’t a state that gets reached, it’s a process that keeps improving. Every sprint surfaces a new gap. Every identified gap is better than a gap nobody knows about.
Closing
A green pipeline doesn’t mean a healthy app.
100% coverage doesn’t guarantee nothing can fail at runtime. Good static analysis is a prerequisite, not a finish line.
The HTTPError 401 from Almira would never have been found by SonarQube because there was nothing wrong with the code. It was found by Sentry because Sentry was watching what was happening — not what was written.
For a system like MediScribe used by doctors in real clinical situations, the difference between “this code was written correctly” and “this app is behaving correctly” isn’t a minor detail. A doctor looking at an empty patient list doesn’t care whether the code passed static analysis. What they need is for the system to work.
Two layers exist because two questions need to be answered. And neither answer can substitute for the other.
MediScribe NG is an AI-powered clinical documentation platform built as part of a software engineering project at Universitas Indonesia. The system transcribes doctor-patient consultations and generates SOAP notes, ICD-10 codes, and prescriptions in real time.
Stack: Django 6.0.3 · SonarQube · Sentry · Azure DevOps · Python 3.12
메타데이터
- post_id
- 17e9381f7510
- slug
- sonarqube-catches-bugs-in-code-sentry-catches-bugs-at-runtime-turns-out-one-isnt-enough-17e9381f7510
- url
- https://medium.com/@brendapo/sonarqube-catches-bugs-in-code-sentry-catches-bugs-at-runtime-turns-out-one-isnt-enough-17e9381f7510
- canonical_url
- https://medium.com/@brendapo/sonarqube-catches-bugs-in-code-sentry-catches-bugs-at-runtime-turns-out-one-isnt-enough-17e9381f7510
- author_url
- https://medium.com/@brendapo
- status
- ok
- fetched_at
- 2026-06-17 12:55:42