📊 Employee Attrition Analysis Dashboard — S.O Ltd
Project Overview
📊 Employee Attrition Analysis Dashboard — S.O Ltd
Project Overview
This project analyzes employee attrition — related factors at S.O Ltd using an interactive dashboard. The objective is to understand workforce composition, employee satisfaction, salary distribution, departmental structure, and the relationships among key HR variables in order to uncover patterns that may influence employee retention and performance.
Dataset Summary
The dataset consists of 14,999 employees and includes variables such as:
- Salary category
- Department
- Satisfaction level
- Time spent at the company
- Number of projects
- Average monthly working hours
- Promotion history
- Work accidents

S.O Ltd. Employees Attrition Dashboard
Questions to answer
- View the data and obtain statistical summaries. Ensure data types are appropriate and there is no missing data. Determine the outcome and input variables.
- Use the whisker boxplot to determine whether there is an outlier in the data.
- Use the appropriate diagram to demonstrate the categorical variable in the data.
- Explain to your manager what actually leads to differences in income (salary).
- Determine the relationship among the variables.
- Plot a necessary graph that you think it will aid in understanding the data.
- Report the conclusions of your analysis by writing a simple explanation that assumes no
- knowledge of statistics.
1. Key Performance Indicators
- Total Employees: 14,999
- Average Satisfaction Level: 0.61
- Average Time Spent at Company: 3.5 years
These KPIs provide a high-level view of employee engagement and tenure within the organization.
2. Outlier detection

Time Spent at Company variable shows noticeable outliers on the higher end, representing employees with significantly longer tenure compared to the majority. These long-tenured employees may reflect retention success or specialized roles within the organization.
Work accidents and promotion last 5 years variables shows outliers due to their binary nature(0,1). Boxplots are less informative for categorical variables, the points do not indicate anomalies but rather the presence or absence of an accident.
3. Categorical variable demonstration

Employees count by salary visualization
Most employees have “low” salary, followed by “medium”, “high” salaries are very few.
The company’s pay structure is skewed toward lower-level earners.
4. Reason for difference in salaries

An analysis of employee attributes across low, medium, and high salary categories reveals that income differences at S.O Ltd are primarily driven by performance, workload, and experience. Employees in higher salary groups consistently show better performance evaluation scores, handle more projects, and record higher average monthly working hours.
In addition, higher-paid employees tend to have longer tenure, indicating that experience and time spent at the company play a significant role in salary progression. While promotions occur slightly more often among higher earners, they are relatively infrequent overall and do not appear to be the main driver of salary variation. Workplace accidents show no meaningful relationship with salary levels.
Overall, the findings suggest that S.O Ltd’s compensation structure largely rewards employee contribution, responsibility, and experience, rather than isolated events or non-performance-related factors.
5. Relationship among the variables
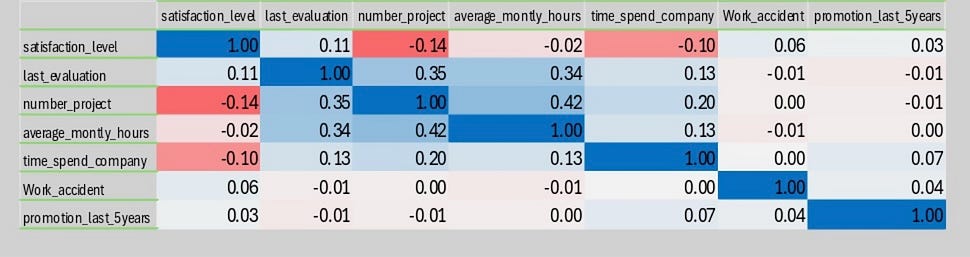
Key relationships identified from the correlation heatmap include:
- A strong positive correlation between number of projects and average monthly working hours, indicating higher workload leads to longer working hours.
- A slight negative correlation between satisfaction level and both workload and time spent at the company, suggesting potential burnout over time.
- Promotions within the last five years show minimal correlation with satisfaction and other variables, indicating limited impact on overall employee engagement.
6. Further analysis
1. Departmental & Salary Breakdown
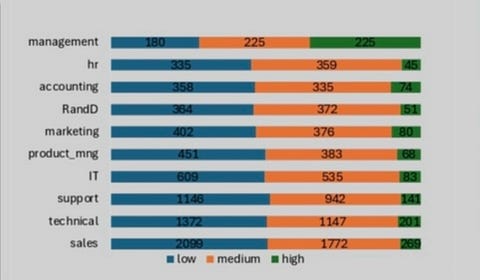
Sales, Technical, and Support departments have the highest employee counts. Across all departments, low and medium salary employees dominate, with high salary roles being limited.
The Sales department, in particular, employs the largest workforce, highlighting its operational importance to the organization.
2. Satisfaction Level by Salary
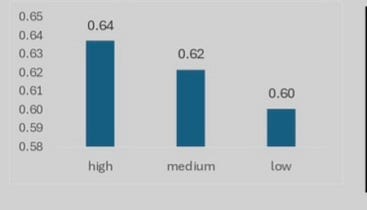
Employee satisfaction shows a positive relationship with salary level:
- High salary: 0.64
- Medium salary: 0.62
- Low salary: 0.60
This trend indicates that higher compensation is associated with increased employee satisfaction, reinforcing the role of pay in employee engagement.
Key Insights
- The majority of employees earn low to medium salaries.
- Higher salaries are associated with higher satisfaction levels.
- Sales, Technical, and Support departments employ the largest number of staff.
- Increased workload is linked to longer working hours and reduced satisfaction.
- Promotion policies appear to have limited influence on employee satisfaction.
📌 Recommendations
- Review compensation structures for low and medium salary employees.
- Improve workload management to reduce burnout.
- Enhance career growth and recognition programs.
- Strengthen promotion policies to positively impact employee satisfaction.
✅ Conclusion
This dashboard provides a comprehensive overview of employee attrition — related factors at S.O Ltd. The analysis highlights salary, workload, and departmental structure as key drivers of employee satisfaction. By addressing these areas, the company can improve retention, engagement, and overall organizational performance.
Tool Used
- Microsoft Excel (Dashboard design, Pivot Tables, KPI calculations)
메타데이터
- post_id
- 18b12bc57f01
- slug
- employee-attrition-analysis-dashboard-s-o-ltd-18b12bc57f01
- url
- https://medium.com/@sultansanni05/employee-attrition-analysis-dashboard-s-o-ltd-18b12bc57f01
- canonical_url
- https://medium.com/@sultansanni05/employee-attrition-analysis-dashboard-s-o-ltd-18b12bc57f01
- author_url
- https://medium.com/@sultansanni05
- status
- ok
- fetched_at
- 2026-06-25 16:53:31



