Calculated Column vs Measure in Power BI: The Difference Every Developer Should Know
One of the first concepts Power BI developers encounter is the distinction between Calculated Columns and Measures. While both are created…
Calculated Column vs Measure in Power BI: The Difference Every Developer Should Know

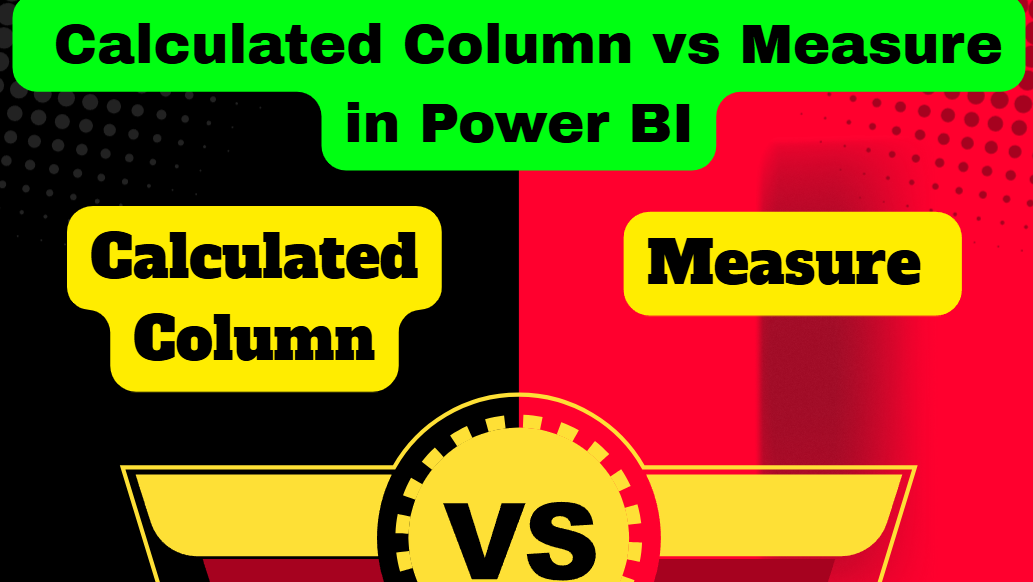
image by Anurodh kumar
One of the first concepts Power BI developers encounter is the distinction between Calculated Columns and Measures. While both are created using DAX (Data Analysis Expressions), they serve different purposes and can significantly impact report performance and model efficiency.
Understanding when to use each can help you build faster, more scalable, and easier-to-maintain Power BI solutions.
What is a Calculated Column?
A Calculated Column creates a new column in a table using a DAX formula. Power BI evaluates the formula for every row and stores the results in the data model.
For example:
Total Price = Sales[Quantity] * Sales[Price]This calculation is performed during data refresh, and the resulting values are saved within the model.
Calculated Columns are useful when you need row-level information that becomes part of your dataset.
What is a Measure?
A Measure is a dynamic calculation that is evaluated only when needed.
Unlike Calculated Columns, Measures are not stored in the model. Instead, Power BI calculates them on the fly based on filters, slicers, and user interactions.
For example:
Total Sales = SUM(Sales[Amount])When users filter data by region, product, or date, the Measure automatically recalculates to reflect the current context.
This makes Measures highly flexible and efficient for reporting.
The Core Difference
The simplest way to remember the distinction is:
- Calculated Columns store results.
- Measures calculate results when needed.
A Calculated Column becomes part of your dataset, while a Measure exists only as a formula until it is used in a visual.
How They Are Evaluated
Calculated Columns
Calculated Columns work using Row Context.
Power BI processes one row at a time and computes a value for each record.
For example:
Profit = Sales[Revenue] - Sales[Cost]Each row receives its own Profit value.
Measures
Measures work using Filter Context.
Power BI evaluates the formula based on the filters currently applied in the report.
For example:
Total Revenue = SUM(Sales[Revenue])The result changes automatically when users interact with slicers or filters.
Impact on Model Size
Because Calculated Columns store values, they increase the size of the Power BI model.
For small datasets, this may not matter much. However, in large enterprise datasets containing millions of rows, additional columns can significantly increase memory consumption.
Measures do not store results, so they have minimal impact on model size.
This is one reason why experienced developers often prefer Measures whenever possible.
Performance Considerations
Performance is another important factor.
Calculated Columns:
- Increase memory usage
- Increase refresh time
- Add data to the model
Measures:
- Use less storage
- Keep models lean
- Adapt dynamically to report filters
For reporting and aggregations, Measures generally provide better scalability.
When to Use a Calculated Column
A Calculated Column is the right choice when:
- You need row-level calculations
- The value must exist in the table
- The result will be used in slicers or grouping
- The calculation should remain fixed until the next refresh
Examples include:
- Profit per transaction
- Product categories
- Customer segmentation
- Extracting year or month from a date
Year = YEAR(Sales[OrderDate])When to Use a Measure
A Measure is the better option when:
- You need aggregated results
- Calculations depend on filters
- Results should change dynamically
- Performance is a priority
Examples include:
- Total Sales
- Total Profit
- Average Revenue
- Profit Margin
- Year-to-Date Sales
Total Sales = SUM(Sales[SalesAmount])Profit Margin =
DIVIDE(
SUM(Sales[Profit]),
SUM(Sales[Revenue])
)A Common Beginner Mistake
Many beginners create Calculated Columns for calculations that should be Measures.
For example:
Sales Total = SUM(Sales[Amount])This type of aggregation should almost always be a Measure.
Creating it as a Calculated Column wastes storage and can negatively affect performance.
Best Practice
A widely accepted Power BI best practice is:
Use Measures by default and create Calculated Columns only when a row-level value is truly required.
This approach keeps your model smaller, improves performance, and makes reports more flexible.
Calculated Columns and Measures are both powerful tools in Power BI, but they solve different problems.
Calculated Columns are ideal for row-level, static calculations that become part of the dataset. Measures are designed for dynamic calculations that respond to filters and user interactions.
The more complex your reports become, the more important this distinction becomes.
If you’re unsure which one to use, ask yourself a simple question:
“Do I need a value stored for every row, or do I need a calculation that changes based on report filters?”
The answer will usually tell you whether a Calculated Column or a Measure is the right choice.
🚀 Mastering this concept is one of the biggest steps toward becoming an efficient Power BI developer.
메타데이터
- post_id
- 2c770265ffe6
- slug
- calculated-column-vs-measure-in-power-bi-the-difference-every-developer-should-know-2c770265ffe6
- url
- https://medium.com/powerbi-microsoft-fabric/calculated-column-vs-measure-in-power-bi-the-difference-every-developer-should-know-2c770265ffe6
- canonical_url
- https://medium.com/powerbi-microsoft-fabric/calculated-column-vs-measure-in-power-bi-the-difference-every-developer-should-know-2c770265ffe6
- author_url
- https://medium.com/@anu.ckp.1313
- status
- ok
- fetched_at
- 2026-06-15 20:49:13