10 Best ERD Tools for Better Visualizing Your Data
Most databases aren’t hard to build. They’re hard to understand. When schemas grow messy and documentation falls behind, the right ERD tool…
10 Best ERD Tools for Better Visualizing Your Data

Most databases aren’t hard to build. They’re hard to understand. When schemas grow messy and documentation falls behind, the right ERD tool makes all the difference.
Hi, I’m Jonathan, an experienced database designer and software engineer. Over the years, I’ve used a variety of ERD (Entity-Relationship Diagram) and database modelling tools, ranging from heavy-duty enterprise applications to quick online editors. After facing limitations again and again, I built ChartDB as an open source ERD diagram tool to solve real problems in database visualization and schema design.
In this post, I’ll share my honest picks for the top 10 ERD diagram tools you should try in 2026. Each tool includes real pros, cons, and current pricing. These are tools I’ve personally tested or used, and I’ve picked them based on what actually matters:
**• Developer-friendly
- • *Clean, modern UI
- • *Programmatic updates
- • *Affordable
- • *Open source (where possible)**
Let’s get into it.
Top 10 Free ERD Database Diagram Tools for 2026

ChartDB

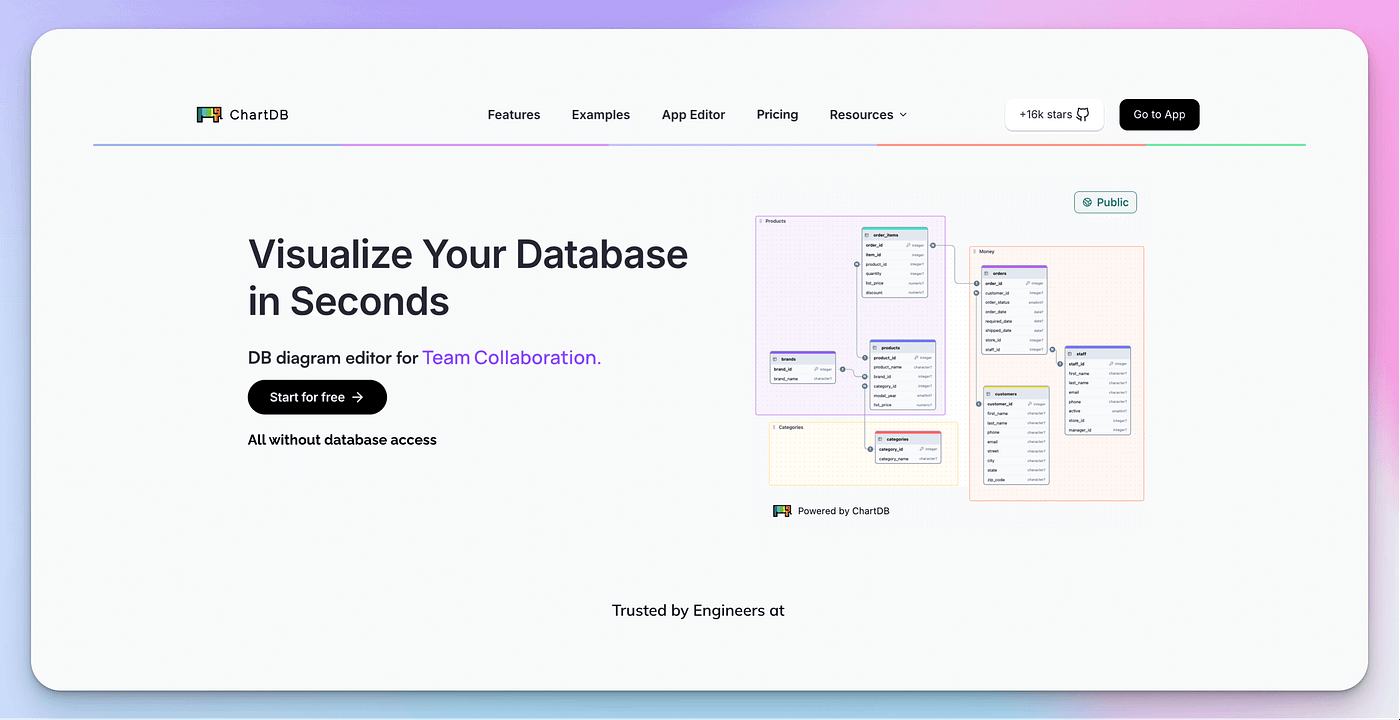
*ChartDB is an open-source data-modeling and ERD tool I created to make database visualization fast and flexible. You can import your schema with a single SQL query, then drag and drop to adjust. It supports PostgreSQL, MySQL, SQLite, SQL Server, MariaDB, and more. There’s also an AI-powered export in open source that generates DDL scripts in the SQL dialect of your choice. *In PRO & later plans you get an AI Assistant that helps generate, edit and find issues quickly with just prompts.
You can self-host it or use the cloud version, and the diagrams stay local in your browser.
Pros: • Developer-friendly • Clean, fast UI • Supports programmatic updates • Free cloud plan and fully open-source • Supports many SQL dialects
Cons: • Still new, some advanced features are in progress • AI export requires OpenAI API key
Pricing: Free to use and open-source. The cloud plan starts from $12.5/ month for one person, Check out detailed pricing here!
Here’s a small video walkthrough on how ChartDB works ⬇️
[embed]
dbdiagram.io

dbdiagram lets you define tables using a DSL (domain-specific language). You write the schema on the left, and the ER diagram renders on the right. It’s great for developers who prefer working in text.
It uses DBML, an open format designed for documenting relational databases. Beyond tables, you can define indexes, composite keys, foreign key constraints, and relationship types directly in the schema. Plus, it has a VS Code extension that allows developers to preview diagrams directly within their editor.
Pros: • Code-based workflow • Fast editing and iteration • Import/export support (SQL, image) • Collaboration and version control
Cons: • Requires learning the DSL • Free plan has diagram limits • No live DB sync
Pricing: Free for up to 10 diagrams. Pro starts at $9/month. Know how: ChartDB is A Better Self Hosted Alternative To dbdiagram
Draw.io / Diagrams.net

Draw.io is a general-purpose diagramming tool with ERD support. It’s open-source, browser-based, and works offline too. You can start diagramming without signing up.
It offers drag-and-drop controls with alignment guides and layering options for organizing complex diagrams.
Users can create custom shape libraries and apply consistent styling across projects. Since ERDs are built manually using shapes, it provides full visual flexibility suitable for modeling both traditional and non-traditional data
Pros:
- • *100% free and open source
- • *Easy to use
- • *Saves locally or to cloud services
- • *Works offline
Cons:
- • *Not tailored for databases
- • *No SQL import/export
- • *Limited collaboration
Pricing: Completely free. Paid add-ons available for Atlassian integrations.
ERDPlus

ERDPlus is a minimal, academic-focused ERD tool. Good for students or quick one-off diagrams. It supports ER diagrams, relational schemas, and star schemas.
The platform allows users to convert ER models into relational schemas automatically and generate SQL statements from them. It follows structured notation rules to help ensure correct entity and relationship modeling.
Pros:
- • *Free
- • *No sign-up needed
- • *Exports SQL and PNG
- • *Simple and focused
Cons:
- • *Very basic visuals
- • *No real collaboration
- • *Not ideal for large schemas
Pricing: Free.
QuickDBD

QuickDBD lets you type your schema and see the ERD instantly. It’s very fast for quick sketches and brainstorming. The tool uses a simple, readable text syntax that converts directly into structured diagrams without drag-and-drop editing.
It supports generating SQL scripts for multiple database systems, including MySQL, PostgreSQL, SQL Server, and Oracle.
Pros:
- • *Text-based schema creation
- • *Live preview
- • *Export to SQL, PNG, PDF
Cons:
- • *Free plan limited to 1 diagram with 10 tables
- • *No collaboration
- • *Must create account to save
Pricing: Free for 1 diagram. Pro starts at $14/month.
Lucidchart

Lucidchart is a full-featured diagramming tool with strong collaboration features. It’s polished and supports templates for ERDs.
It offers advanced formatting controls, conditional styling, and presentation mode for structured walkthroughs. Users can link diagrams to external data sources to keep visuals updated dynamically.
It also supports automation, which makes it one of the AI ERD tools with built-in intelligent features.
Pros:
- • *Beautiful interface
- • *Great team collaboration
- • *Lots of templates
- • *Integration with Google, Microsoft, etc.
Cons:
- • *Free plan limited to 3 diagrams and 60 objects
- • *Paid plans can be pricey
- • *Not database-specific
Pricing: Free for 3 diagrams. Paid plans from $8/month.
DrawSQL

DrawSQL is built specifically for database diagrams. You can import a SQL script, design schemas visually, and export DDL scripts. Supports organizing projects into workspaces for structured schema management.
The tool allows tracking schema changes over time and also supports multiple database engines when generating scripts.
Pros:
- • *Focused on ERDs
- • *Clean interface
- • *Real-time collaboration
- • *Large template library
Cons:
- • *Free plan limited to public diagrams with 15 tables
- • *No offline mode
Pricing: Free for 1 user and public diagrams. Paid plans from $15/month. Know how: ChartDB is A Better Alternative To DrawSQL
DbSchema

DbSchema is a desktop tool with support for 70+ databases. You can reverse-engineer schemas or design offline. Very powerful. It offers interactive data exploration features that let users visually browse tables and run queries directly from the diagram interface.
The platform also supports visual query building and schema comparison, helping teams track structural differences between database versions. It works with both SQL and NoSQL systems, including cloud databases.
Pros:
- • *Works offline
- • *Supports many databases
- • *Reverse engineering
- • *Schema documentation
Cons:
- • *Desktop only
- • *UI is a bit dated
- • *Not open source
Pricing: Community Edition is free. Pro is $19/month or $98 one-time.
SqlDBM

SqlDBM is a modern, cloud-based visual database modeler. Clean UI with multi-dialect support. Aimed at teams and enterprises.
It supports forward engineering by generating database scripts directly from visual models and allows schema comparison to identify structural differences between environments.
Pros:
- • *Fully visual, no code required
- • *Modern interface
- • *Multi-database support
Cons:
- • *Free version is limited and time-bound
- • *Paid plans are pricey
- • *No self-hosted option
Pricing: Free trial. Paid plans start at $25/month. Know how: ChartDB is A Better OpenSouce & Lightweight Over SqlDBM
Vertabelo

Vertabelo is an enterprise-focused web-based modeler. Supports logical and physical modeling. Allow users to generate database scripts from models or build diagrams from existing databases.
It also supports multiple database engines and provides detailed diagram customization options for complex systems.
**Pros: ** • Comprehensive modeling
- • *Versioning and validation
- • *Team collaboration
- • *Clean diagrams
**Cons: ** • No permanent free plan
- • *Learning curve
- • *Cloud-only
Pricing: Free trial. Individual plan starts at $24/month.
Common Use Cases (With Real Benefits)
These quick examples show how ERD tools, especially ChartDB, help solve real problems:
Problem: You inherit a messy database and can’t figure out where things connect. Solution: Use ChartDB to auto-generate an ER diagram from a SQL dump or live DB. Result: You instantly see relationships, spot duplicates, and clean up the schema faster.
Problem: Your team forgets to track when rows were created or updated.
Solution: Run ChartDB’s AI agent to auto-add created_at and updated_at across tables.
Result: Clear audit trails and easier debugging later on.
Problem: You need to review or share schema changes visually with a product or BI team. Solution: Generate a live, shareable ERD link in ChartDB or export as PNG. Result: No more back-and-forth explaining what changed or what tables do.
Problem: You want to create a schema from scratch but don’t want to write raw SQL. Solution: Use AI prompts like “Create a schema for a blog with posts, authors, and comments.” Result: You get a visual ERD and working SQL you can copy into your DB.
Frequently Asked Questions
What is an ER Diagram and why is it important?
An Entity-Relationship Diagram (ERD) is a visual blueprint of your database. It shows how tables connect, which fields they share, and how data flows across your system. ERDs help developers, analysts, and product teams communicate clearly, spot issues early, and build scalable, consistent databases.
In short, an ERD is the difference between guessing how your data fits together and knowing it.
👉 If you want a deeper explanation with examples, history, and step-by-step tips, read our complete guide on ER diagrams.
How can I choose the right ERD tool for my project?
Start with how you work best:
- If you prefer text-based design, try ChartDB, dbdiagram or QuickDBD.
- If you love drag-and-drop visuals, tools like ChartDB or DrawSQL make it effortless.
- If you need collaboration and versioning, ChartDB, Lucidchart or Vertabelo might fit your team.
- And if you care about open-source and privacy, ChartDB or Draw.io are your best bets.
There’s no single right choice — it depends on your workflow and priorities.
What are the key features to look for in an ERD tool?
Here’s what actually matters when picking one:
- Database support: Postgres, MySQL, SQL Server, SQLite, and more
- Import/export: Easy SQL or DDL import and export
- Visualization: Clear, responsive diagrams that scale
- Collaboration: Multi-user editing, comments, and sharing
- Automation: AI or smart features for generation and updates
- Integrations: Cloud sync or app integrations (GitHub, Notion, etc.)
- Pricing: Fair, transparent plans that match your usage
A great ERD tool should make design faster, not harder.
What are the limitations of free ERD tools?
Most free plans limit you to a small number of diagrams, tables, or collaborators. You’ll get enough for personal projects or prototypes, but teams or large schemas usually need a paid plan for real collaboration, SQL sync, or export features.
If you’re looking for a fully free and open-source option, ChartDB and Draw.io both let you self-host or work offline without restrictions.
Most teams begin with a free ERD diagram tool for small projects or prototypes, but larger schemas usually need advanced collaboration features.
Can free ERD tools export diagrams to SQL or image formats?
Yes. Most tools on this list support exporting diagrams to PNG, PDF, or SQL scripts. ChartDB, DrawSQL, dbdiagram, and QuickDBD all support SQL export.
Do free ERD tools support all types of databases?
Most free tools cover the popular ones like PostgreSQL, MySQL, SQLite, and SQL Server. Tools like DbSchema go further and support NoSQL or hybrid systems such as MongoDB. ChartDB, in particular, supports both modern SQL dialects and lightweight databases like SQLite, making it versatile for both startups and enterprises.
Can free ERD tools export diagrams to SQL or images?
Yes. Most of them can export your diagrams as SQL scripts, images (PNG/JPG), or PDFs for documentation. ChartDB, DrawSQL, dbdiagram, and QuickDBD all support SQL export directly, so you can design visually and then apply your schema instantly in your database.
How do the AI feature improve ERD creation?
ChartDB’s AI agent can automatically generate database schemas from a text prompt, find missing foreign keys, add timestamps, detect anomalies, or optimize naming conventions.
You can say things like “Add soft deletes to all tables” or “Suggest relationships for orphaned tables” and see it happen instantly. It’s a simple but powerful way to save time and prevent human errors, something no traditional ERD tool offers yet.
Conclusion
There’s no single best ERD tool. Your choice depends on how you work: text-first, drag-and-drop, collaboration, or automation. Try a few and see which one fits the best in for your use case.
If you want a free, open-source, modern tool designed for developers, give ChartDB a try. It’s fast, clean, and built by someone who needed better tooling.
Also, I am one of the co-founders of ChartDB. In case, you would need my help to visualize your database, I am here to help 🙂
If you have any questions, hit us on the chat!
Let me know your thoughts or suggestions below.
Additional Resources
메타데이터
- post_id
- 689b316d5dda
- slug
- 10-best-erd-tools-for-better-visualizing-your-data-689b316d5dda
- url
- https://medium.com/@chartdb/10-best-erd-tools-for-better-visualizing-your-data-689b316d5dda
- canonical_url
- https://medium.com/@chartdb/10-best-erd-tools-for-better-visualizing-your-data-689b316d5dda
- author_url
- https://medium.com/@chartdb
- status
- ok
- fetched_at
- 2026-07-14 10:49:49