Forwarding NetFlow and Syslog from Ubiquiti UDM Pro to Security Onion 2.4
Security Onion (SO) is a powerful open-source platform for network security monitoring, intrusion detection, and log analysis. Pairing it…
Forwarding NetFlow and Syslog from Ubiquiti UDM Pro to Security Onion 2.4
Security Onion (SO) is a powerful open-source platform for network security monitoring, intrusion detection, and log analysis. Pairing it with a Ubiquiti UDM Pro gives you rich visibility into your home or lab network. In this guide, I’ll walk through how I set up my UDM Pro to forward Syslog and NetFlow/IPFIX into Security Onion 2.4 and how I configured Security Onion to ingest them.
Why Forward Logs and Flows?
- Syslog gives you firewall, DPI, and system events from the UDM Pro.
- NetFlow/IPFIX summarizes traffic flows, letting you see which devices talk, how much data is transferred, and which VLANs are involved.
- Together, these enrich Security Onion’s dashboards and alerts with full network context.
Part 1 — Forwarding NetFlow/IPFIX and Syslog from UDM Pro
Step 1. Syslog on the UDM Pro:
- Navigate to Settings → CyberSecure→ Traffic Logging.
- Add a new remote syslog server: SIEM Server
- Contents: Select desired logs
- Collector Address:
10.10.101.179 - Port:
514(default syslog UDP) - Protocol: UDP
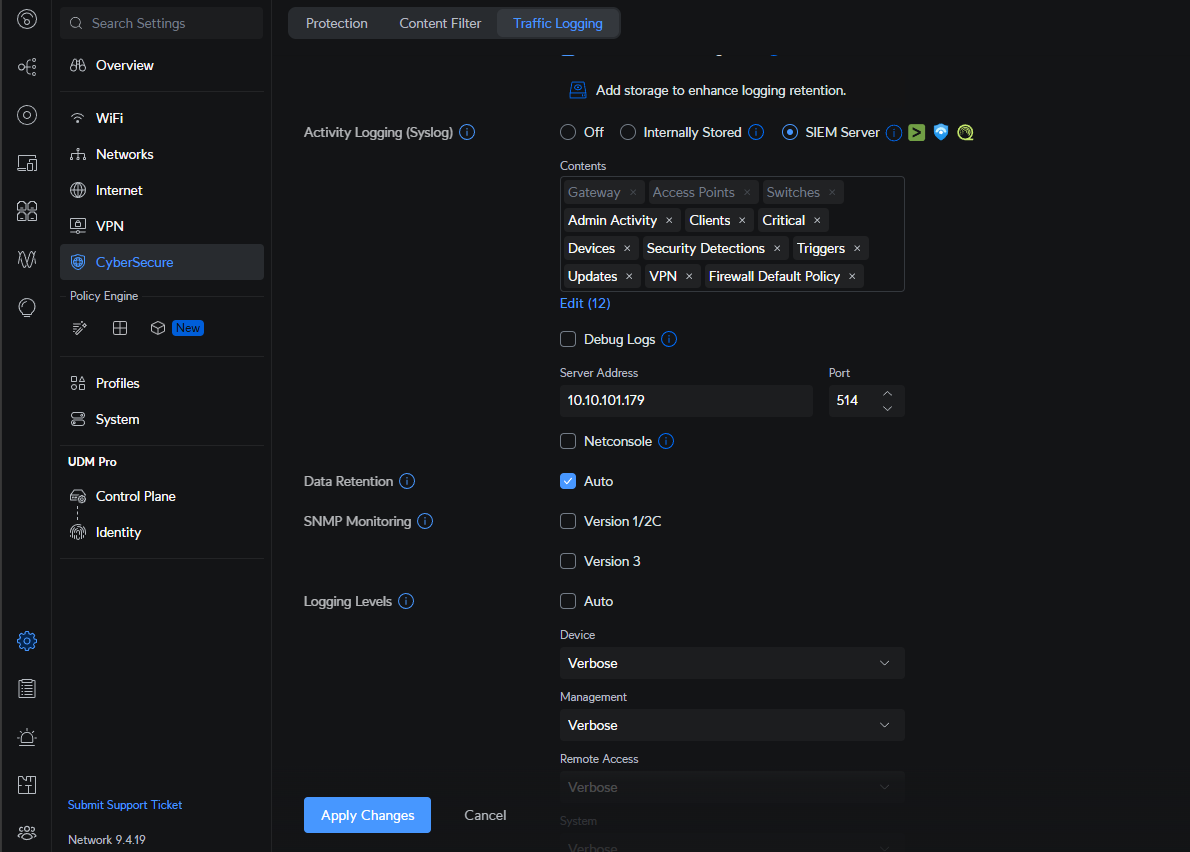
Dream Machine Pro Syslog
Step 2. NetFlow/IPFIX from UDM Pro
- Enable per-VLAN (e.g., VLAN 100, 102).
- Collector Address:
10.10.101.179 - Port:
2055 - Version: IPFIX 10

Dream Machine Pro NetFlow (IPFIX)
Step 3. Forwarding UDM Pro Control-Plane Logs (CEF/Syslog 9003)
While NetFlow and standard Syslog provide great visibility into traffic and firewall events, the Control Plane on the UDM Pro can emit a much richer feed of security-relevant telemetry — including intrusion detections, admin activity, and firmware updates — directly from UniFi OS itself. These events are packaged as Common Event Format (CEF) syslog messages and are perfect for ingestion into Security Onion’s Elastic Fleet integrations.
Enable SIEM Server Logging in UniFi Network
- Log into your UniFi Network Controller (UDM Pro web UI).
- Navigate to Settings → Control Plane → Integrations.
- Under Activity Logging (Syslog), select SIEM Server.
In Categories, check the event types you care about — I applied:
- Device and Client for infrastructure visibility
- Triggers and Updates for system events
- Admin Activity and Security Detections for audit trails
Check Include Raw Logs to capture full messages for forensic value.
- Set Server Address to your Security Onion node’s IP (for example
10.10.101.179). - Set Port to 9003 and leave Protocol = UDP.
- Click Send Test Event — you should see the test message arrive in Security Onion within a few seconds if the firewall is open.

Dream Machine Pro CEF Integration
Step 4. Enabling Firewall Rule Logging for iptables Visibility
While NetFlow and CEF provide a high-level view of your UniFi network, firewall rule logs are where you see the detailed packet-level decisions — which traffic was allowed, blocked, or rejected.
These logs are generated by UniFi’s Policy Engine (iptables) and can be forwarded to Security Onion over UDP port 9001 as standard Syslog messages.
Once enabled, Security Onion parses them into the iptables.log dataset (or syslog if you use the generic integration), allowing you to correlate policy events with NetFlow and CEF telemetry.
Why Enable Per-Rule Syslog Logging
Each firewall rule in the UDM Pro can independently generate log events. Enabling Syslog Logging ensures:
- You capture blocked and allowed traffic decisions for analysis in Security Onion.
- Events include source/destination IPs, ports, protocols, and actions, giving context to NetFlow records.
- Security Onion can build iptables dashboards showing which rules trigger most often, top blocked hosts, and unexpected internal traffic patterns.
Without this setting, UniFi silently processes packets, leaving you blind to real-time firewall behavior.
Edit Firewall Rules in UniFi
- Log into your UDM Pro → Settings → CyberSecure → Policy Engine → Policy Table.
- For each rule you want visibility on, click Edit.
- Scroll to the bottom of the rule settings and enable ✅ Syslog Logging.
- (Optional but recommended) Add a Description such as
Block - VLAN100 to InternetorAllow DNS Internal. - Save and apply the rule.
Press enter or click to view image in full size
UDM Pro Firewall Rule Configuration — Syslog Logging Enabled

UniFi Firewall Rules

Unifi Firewall Rule: Enable Syslog Logging
Part 2— Security Onion NetFlow/IPFIX and Syslog Ingestion
Now that the UDM Pro is exporting, we need to tell Security Onion to accept and process those logs and flows.
Step 1: Open the SOC Web UI
- From your workstation, go to
https://<so-ip>/and log in with your analyst account. - If your workstation isn’t allowed yet, SSH into the SO box and run:
sudo so-firewall includehost analyst <your-workstation-ip>- Then try the SOC UI again.
Step 2: NetFlow Records Integration in Security Onion.
- On left panel, select Elastic Fleet. New tab will open titled Agents- Feet.
- Click on the
Agent policiestab, and then click the desired policy (for exampleso-grid-nodes_general). - Click the
Add integrationbutton. - Search for
netflowand then click on theNetFlow Recordsintegration. - The Elastic Integration page will show an overview of the NetFlow Integration. Review all information on the page and then click the
Add NetFlow Recordsbutton. - On the
Add NetFlow Records integrationscreen, go to theUDP host to listen onfield and changelocalhostto0.0.0.0. Verify theUDP port to listen onfield matches what your NetFlow exporter will be sending to. In my case the port is the default 2055. Click theSave and continuebutton and then clickSave and deploy changes.

Elastic Fleet NetFlow Records Integration.
Step 2a: Syslog Records Integration in Security Onion.
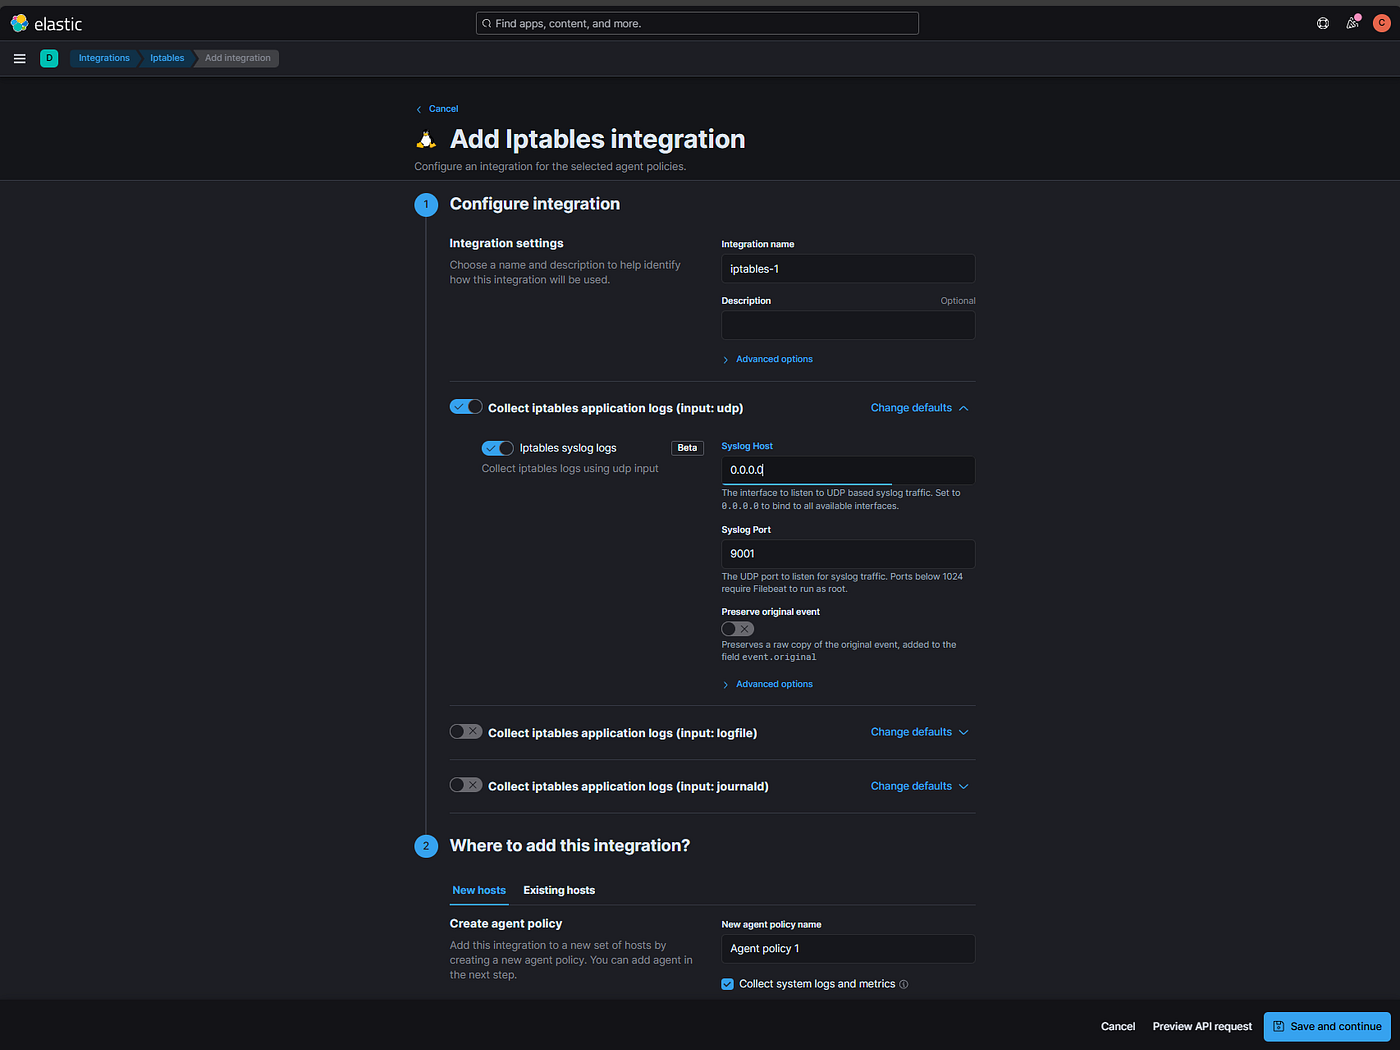
Step 2b: CEF Records Integration in Security Onion.

Step 3: Configure Firewall Rules in SOC
- Go to Administration → Configuration → firewall.
- Enable Show advanced settings (Options menu).
- Add your UDM’s IP to a hostgroup:
- Select
hostgroups → customhostgroup0. - Add
10.10.101.253(or your UDM’s syslog/flow source IP).

- Add the syslog and NetFlow ports to a portgroup:
- Select
portgroups → customportgroup0 → udp. - Add
514and2055.
- Link hostgroup and portgroup to your Security Onion role:
- Navigate to
role → so-standalone → chain INPUT → hostgroups customhostgroup0 → portgroups. - Add
customportgroup0.
- Click the checkmark to save, then Options → Synchronize Grid to push changes.
Step 4 — Verify Ingestion
SSH into Security Onion Host
- Once you’ve configured the NetFlow (2055), iptables Syslog (9001), and CEF Control Plane (9003) integrations, it’s time to confirm that Security Onion is actively listening on those ports and successfully ingesting UniFi logs.
Check Active Listening Ports
SSH into your Security Onion host and run the following command to verify that the agentbeat service is listening for incoming UDP traffic on the correct ports:
sudo ss -lunp | egrep ':(2055|9001|9003)'If everything is configured properly, you should see output similar to this:

This confirms that the Elastic Agent (agentbeat) is actively listening for:
- 2055 → NetFlow Records
- 9001 → iptables Syslog (Firewall Logs)
- 9003 → CEF Logs (UniFi OS and Control Plane)
If any of these ports are missing, double-check that:
- The corresponding integration is enabled under Fleet → Agent Policies → so-grid-nodes_general.
- Syslog host is set to
0.0.0.0to bind all interfaces. - The integration changes were saved and deployed.
For the next could of tcpdump commands figure out what your interface is that you are ingesting logs on. Use ifconfig and look for the corresponding interface that you are sending traffic to. In my case I am sending traffic to 10.10.101.104, So I am looking for the interface with that IP address (or MAC address if you know that from set up). In my case I want to tcpdump on interface ens37, all of my commands will use that interface.

ifconfig for correct interface
sudo tcpdump -i ens37 port 2055
tcpdump port 2055
Verify Elasticsearch Data Streams
Once the ports are listening, confirm that data is flowing into Elasticsearch by listing the data streams: You should see each dataset (cef.log, syslog, netflow.log, iptables.log) represented. If any are missing, it may indicate that no logs have yet been received or parsed.
data_stream.dataset: "cef.log"
Kibana: CEF Data Stream
data_stream.dataset: "*syslog"
Kibana: Syslog Data Stream
data_stream.dataset: "netflow.log"
Kibana: Netflow Data Stream
data_stream.dataset: "iptables.log"
Kibana: IP Tables Data Stream
This confirms that data has been indexed and is searchable in Kibana.
NetFlow dashboard
To verify that you are receiving NetFlow logs go to Dashboards and select the NetFlow dashboard to see your NetFlow records.

Security Onion Netflow Dashboard

Elastic Search Netflow Dashboard

Kibana Netflow Geo Location
Firewall — UniFi System Dashboard
Once the Control Plane feed (port 9003) is active, you can visualize UniFi’s CEF-formatted logs inside Security Onion’s dashboards.
The screenshots below show a working example of my setup, where Security Onion parses events generated by UniFi OS 4.3.6 and categorizes them using CEF fields such as cef.device.vendor, cef.device.product, and cef.device.event_class_id.
The Basic Metrics and Group Metrics panels summarize which event classes occur most frequently — here you can see admin and system activity broken down by device type, vendor, and version. These views make it easy to distinguish authentication events, firmware updates, and system-level configuration changes coming from your UDM Pro.
The Events table at the bottom provides full message visibility for each record, showing when specific users accessed the UniFi console or modified settings. Because these messages are normalized in CEF, you can filter or correlate them with NetFlow and traffic Syslog events in the same dashboards.
Together, these panels turn raw UniFi telemetry into actionable insight — letting you trace administrative logins, firmware upgrades, and security detections across your entire home or lab environment with the same analytic power used in enterprise deployments.
Press enter or click to view image in full size

Security Onion Prebuilt Dashboard: Firewall — UniFi System

Security Onion Prebuilt Dashboard: Firewall — UniFi System cont.
( STILL UNDER DEVELOPMENT)
메타데이터
- post_id
- 6b1b3ad0be92
- slug
- forwarding-netflow-and-syslog-from-ubiquiti-udm-pro-to-security-onion-2-4-6b1b3ad0be92
- url
- https://medium.com/@cybercoinz/forwarding-netflow-and-syslog-from-ubiquiti-udm-pro-to-security-onion-2-4-6b1b3ad0be92
- canonical_url
- https://medium.com/@cybercoinz/forwarding-netflow-and-syslog-from-ubiquiti-udm-pro-to-security-onion-2-4-6b1b3ad0be92
- author_url
- https://medium.com/@cybercoinz
- status
- ok
- fetched_at
- 2026-06-24 13:29:15