Technical Analysis vs Price Action: How Traders Choose the Right Market Reading Method
Introduction
Technical Analysis vs Price Action: How Traders Choose the Right Market Reading Method
Technical Analyis
Introduction
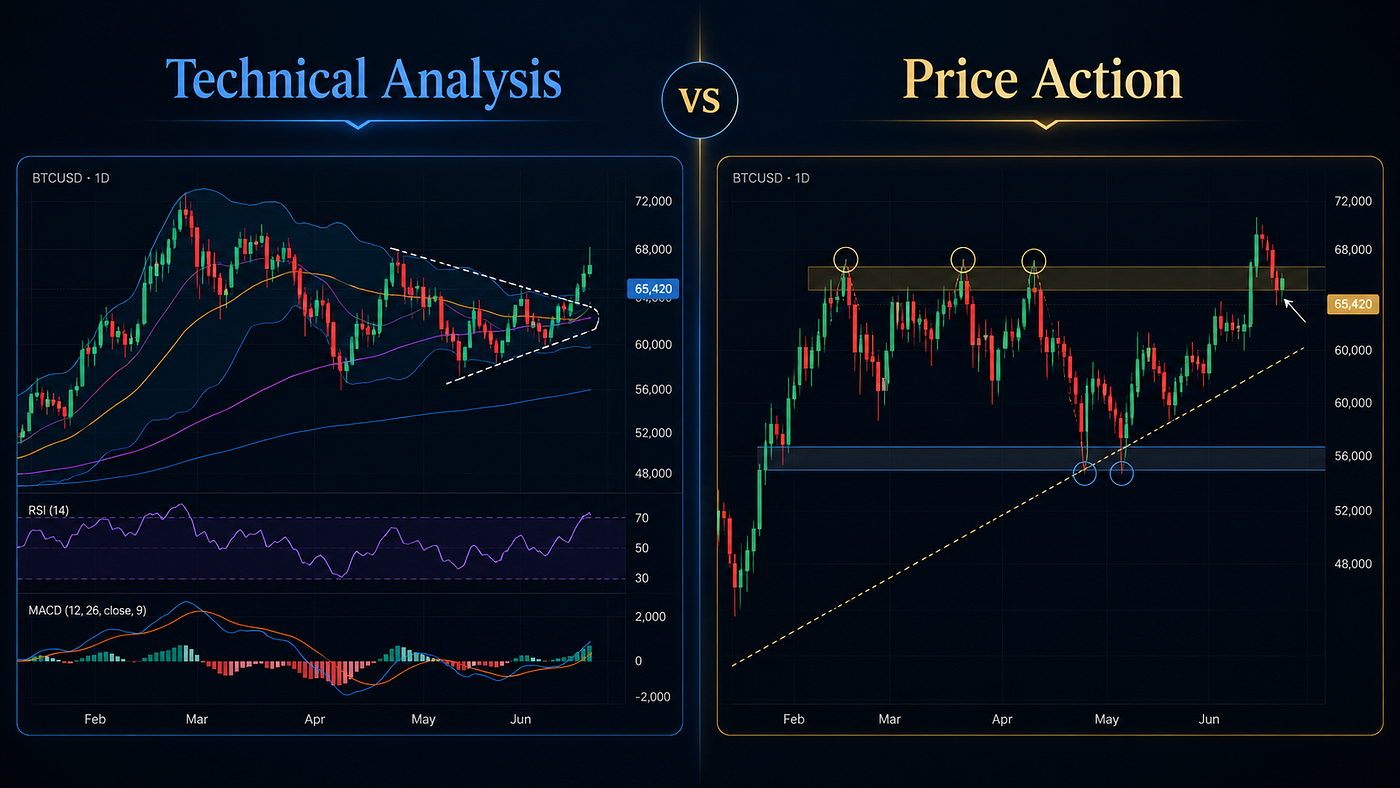
Technical analysis vs price action is one of the most important comparisons every trader should understand. Many beginners think both terms mean the same thing, but they are not exactly identical. Technical analysis is a broad method that uses charts, indicators, patterns, support, resistance, volume, and trend tools to study market behavior. Price action is a cleaner style of chart reading that focuses mainly on raw price movement, candlesticks, market structure, support, and resistance.
Both approaches help traders make better decisions. Both can work in stocks, indices, commodities, forex, ETFs, and cryptocurrencies. However, they work in different ways. A technical trader may use RSI, moving averages, Bollinger Bands, MACD, volume indicators, and chart patterns. A price action trader may remove most indicators and focus on how price reacts around key levels.
The real question is not which method is superior. The better question is how traders can use both methods together. A strong trading process often begins with price action and then uses technical indicators for confirmation. This article explains the difference between technical analysis and price action, how both methods work, where beginners make mistakes, and how traders can combine them with risk management, market context, and timing insights from the Financial Astrology Terminal.
What Is Technical Analysis?
Technical analysis is the study of market price behavior using charts and mathematical tools. Traders use technical analysis to identify trends, momentum, volatility, support, resistance, breakouts, reversals, and possible trading opportunities.
Technical analysis includes many tools. Moving averages help traders identify trend direction. RSI helps traders spot overbought and oversold zones. Bollinger Bands help traders study volatility. Chart patterns help traders understand consolidation, continuation, and reversal setups. Volume helps traders confirm whether a move has strong participation.
A technical trader may look at a chart and ask several questions. Is price above the 50-day moving average? Is RSI above or below 50? Are Bollinger Bands expanding or contracting? Has price broken resistance? Is volume rising during the breakout?
This approach can be useful because it gives structure. Indicators can simplify complex market behavior. However, technical analysis can also become confusing if traders use too many tools at once. A chart with ten indicators may create more noise than clarity.
What Is Price Action?
Price action is the study of raw price movement. A price action trader focuses on candles, highs, lows, support, resistance, trend structure, breakouts, pullbacks, and market behavior around key levels.
Price action usually avoids heavy use of indicators. Instead of asking what RSI or MACD is doing, a price action trader studies what price itself is doing. Is price making higher highs and higher lows? Is it rejecting resistance? Is it forming a strong bullish candle near support? Is the breakout holding, or is price falling back into the range?
Price action is powerful because price is the source of all technical indicators. Every indicator is calculated from price or volume. Price action traders prefer to read the source directly.
However, price action also requires practice. A beginner may find it subjective at first. Two traders may draw support and resistance zones differently. One trader may see a breakout, while another may see a false move. This is why price action still needs rules, discipline, and risk management.
Technical Analysis vs Price Action: The Core Difference
The main difference in technical analysis vs price action is the use of tools.
Technical analysis is broad. It includes price action, indicators, chart patterns, volume studies, moving averages, oscillators, and volatility tools. Price action is more focused. It studies price movement directly, usually with fewer indicators.
A technical trader may rely on a moving average crossover to confirm a trend change. A price action trader may look at higher highs and higher lows to identify the same trend change. A technical trader may use RSI divergence to spot weakening momentum. A price action trader may look at failed breakouts and rejection candles near resistance.
Both traders may reach similar conclusions, but their process differs. Technical analysis uses more calculated tools. Price action uses more direct chart reading.
The best traders do not turn this into a competition. They understand that price action forms the foundation, while technical indicators can add confirmation.
Why Beginners Confuse Technical Analysis and Price Action
Beginners often confuse technical analysis and price action because both use charts. Both involve candlesticks, support, resistance, and trend direction. The difference becomes clear only when you look at the decision-making process.
A beginner using technical analysis may add several indicators to the chart and wait for signals. For example, they may buy when RSI rises, moving averages cross, and MACD turns positive.
A beginner using price action may remove most indicators and focus on whether price breaks above resistance, retests the level, and continues higher.
The confusion also comes from online trading content. Many traders use the terms loosely. Some call every chart-based method technical analysis. Others use price action as a separate trading style.
A practical way to understand it is simple: price action is a part of technical analysis, but technical analysis is larger than price action.
Price Action as the Foundation of Technical Analysis
Price action should be the foundation of technical analysis because every indicator depends on price. Moving averages come from past prices. RSI comes from recent gains and losses. Bollinger Bands come from price volatility. MACD comes from moving average relationships.
If a trader does not understand price structure, indicators can become misleading. For example, RSI may show oversold conditions, but if price is breaking below major support, buying may be risky. A moving average crossover may look bullish, but if price is directly under strong resistance, the trade may have poor risk-reward.
Price action helps traders understand location. It shows where buyers defended support, where sellers rejected price, and where the market changed direction. Indicators can then confirm whether momentum or volatility supports the setup.
This is why many experienced traders start with price action first. They mark trend, support, resistance, and structure. Then they add technical tools only if those tools improve the decision.
Role of Indicators in Technical Analysis
Indicators can help traders see market conditions more clearly. They are especially useful when traders need confirmation.
RSI helps traders measure momentum. It can show when price is overbought, oversold, or losing strength through divergence. Moving averages help traders identify trend direction. Bollinger Bands help traders understand volatility expansion and contraction. MACD helps traders study momentum shifts.
However, indicators should not control the trader. They should support the trader’s reading of price. A common beginner mistake is waiting for every indicator to agree. This can create late entries. Another mistake is acting on one indicator without checking price structure.
Indicators work best when they answer specific questions. Is momentum improving? Is volatility expanding? Is price above or below the trend average? Is volume confirming the move?
When traders use indicators with purpose, technical analysis becomes practical. When they add indicators without purpose, the chart becomes cluttered.
Support and Resistance in Both Methods
Support and resistance matter in both technical analysis and price action.
Support is a price zone where buyers may enter. Resistance is a price zone where sellers may appear. A price action trader uses these zones as the core of the strategy. They watch how candles behave around those levels.
A technical trader also uses support and resistance, but may confirm them with indicators. For example, if price falls to support and RSI becomes oversold, the technical trader may watch for a rebound. If price reaches resistance and Bollinger Bands show stretched volatility, the trader may become cautious.
Support and resistance give traders a map. They help define entries, exits, stop-losses, and targets. Without these levels, both price action and technical analysis become weaker.
You can study this topic further through the internal guide on Support and Resistance in Technical Analysis.
Trend Reading in Technical Analysis vs Price Action
Trend reading is central to technical analysis vs price action.
A price action trader identifies trend by studying swing highs and swing lows. An uptrend forms when price makes higher highs and higher lows. A downtrend forms when price makes lower highs and lower lows. A sideways market forms when price moves between support and resistance.
A technical trader may identify trend with moving averages. If price stays above a rising 50-day moving average, the trend may be bullish. If price stays below a falling 200-day moving average, the trend may be bearish.
Both methods can work. Price action gives a direct view of structure. Moving averages give a smoother view of direction.
The strongest signals often appear when both agree. If price action shows higher highs and higher lows while price remains above rising moving averages, the uptrend has stronger confirmation.
Candlesticks and Market Psychology
Candlesticks are a major part of price action. They show how buyers and sellers behave during a selected period.
A strong bullish candle near support may show that buyers are defending the level. A long upper wick near resistance may show that sellers rejected higher prices. A small candle after a large move may show indecision.
Technical traders also use candlesticks, but they may combine them with indicators. For example, a bullish candle near support becomes more interesting if RSI is recovering from oversold conditions. A bearish candle near resistance becomes more meaningful if volume rises during selling.
Candlesticks help traders read market psychology. They show confidence, rejection, hesitation, and momentum. This makes them useful in both price action and broader technical analysis.
Chart Patterns and Price Structure
Chart patterns connect technical analysis and price action. Patterns such as triangles, rectangles, double tops, double bottoms, flags, and head and shoulders formations are built from price movement.
A price action trader may study the pattern without indicators. They may wait for price to break a neckline, resistance zone, or trendline. A technical trader may add volume, RSI, moving averages, or Bollinger Bands for confirmation.
For example, a double bottom becomes stronger when price breaks the neckline with strong volume. A triangle breakout becomes more useful when Bollinger Bands expand and RSI moves above 50.
You can study more through the internal guide on Chart Patterns Every Technical Trader Should Know.
Moving Averages vs Raw Price Structure
Moving averages are popular because they smooth price movement. They help traders avoid reacting to every small candle.
A technical trader may use a moving average crossover to identify a trend change. A price action trader may study whether price has broken a previous high or formed a higher low.
Both methods can identify trend shifts. The difference is timing. Price action may react faster because it reads raw price. Moving averages may react later because they use past prices. However, moving averages can reduce noise and help traders avoid false signals.
A balanced trader may use both. They may read price structure first, then check whether moving averages confirm the trend.
You can explore this topic through the internal guide on Moving Average Crossover Strategy.
RSI and Price Action
RSI is a momentum indicator. Price action is raw chart behavior. When used together, they can create better trade signals.
For example, price may fall into support and form a bullish rejection candle. If RSI also shows oversold conditions or bullish divergence, the setup becomes stronger.
Price may rise into resistance and form a bearish rejection candle. If RSI shows overbought conditions or bearish divergence, traders may become cautious.
However, traders should never use RSI alone. RSI above 70 does not always mean sell. RSI below 30 does not always mean buy. Price action shows where the signal appears. RSI shows momentum behind it.
For more detail, read the internal guide on RSI Indicator Explained.
Bollinger Bands and Price Action
Bollinger Bands help traders study volatility. Price action helps traders study structure.
A price action trader may notice that price is compressing into a tight range. A technical trader may see the same thing through narrowing Bollinger Bands. When bands contract, volatility is low. When price breaks out and bands expand, volatility returns.
A lower band touch near support may become more useful if price forms a bullish rejection candle. An upper band touch near resistance may become more useful if price forms a bearish rejection candle.
Bollinger Bands should not replace price action. They should help traders understand whether price is stretched, calm, or entering a volatility expansion phase.
You can read more in the internal guide on Bollinger Bands in Technical Analysis.
Which Method Is Better for Beginners?
Beginners should start with price action, then add technical indicators slowly. This approach keeps charts clean and helps traders understand the source of market signals.
Start by learning support, resistance, trend direction, candlestick behavior, and market structure. Once these basics are clear, add one or two indicators. RSI and moving averages are enough for most beginners.
The goal is not to fill the chart with tools. The goal is to build a decision process.
A beginner who understands price action can use indicators more wisely. A beginner who depends only on indicators may struggle when signals conflict.
In the debate of technical analysis vs price action, the best answer for beginners is not either-or. Start with price action. Use technical analysis tools for confirmation.
Risk Management in Both Approaches
Risk management matters more than the method. A trader can use price action or technical analysis and still lose money without proper risk control.
Every trade needs a stop-loss. Every trade needs a target. Every trade needs position sizing. The trader should know where the trade idea becomes wrong before entering.
If you buy near support, the stop-loss may sit below support. If you buy after a breakout, the stop-loss may sit below the breakout level or recent swing low. If you sell near resistance, the stop-loss may sit above resistance.
Risk-reward should guide the trade. If the possible reward is too small compared with the risk, skip the setup.
No method removes risk. A strong trader manages risk before thinking about profit.
Financial Astrology Terminal as a Timing Layer
The Financial Astrology Terminal helps traders and investors combine market data, charts, watchlists, global stocks, indices, commodities, and financial astrology-based timing insights in one platform.
Price action helps traders read structure. Technical analysis helps traders confirm momentum, trend, and volatility. The Financial Astrology Terminal can add a timing layer. Traders can use it to study market data, watchlists, global assets, charts, and timing windows together.
This does not replace technical analysis or price action. It adds context. A practical process can work like this: price action defines structure, technical indicators confirm strength or weakness, timing insights prepare the trader, and risk management protects capital.
This approach helps traders move from reaction to preparation. It also encourages discipline rather than blind prediction.
Market Context Matters
A trader should not study one chart in isolation. Broader market context matters.
A bullish price action setup may fail if major indices are falling. A bearish technical signal may fail if the broader market is recovering. Traders should review indices, sectors, commodities, interest-rate expectations, and global sentiment before entering.
You can study broader conditions through the global markets section. This helps traders understand whether a setup aligns with the larger market environment.
Market context can make a good setup stronger or weaker. Traders should respect it.
Common Mistakes Traders Make
The first mistake is treating indicators as automatic signals. A moving average crossover, RSI reading, or Bollinger Band touch should not trigger a trade without price confirmation.
The second mistake is making price action too subjective. Traders should define clear rules for support, resistance, trend, and candle confirmation.
The third mistake is using too many tools. A cluttered chart creates confusion.
The fourth mistake is ignoring risk. A trader can be right about direction but still lose money if the entry is poor and the stop-loss is too wide.
The fifth mistake is changing methods constantly. Traders need consistency to learn what works.
A Simple Combined Trading Framework
A simple framework can combine both methods.
First, read price action. Identify trend direction, support, resistance, and market structure. Second, study candlesticks near key levels. Third, add technical indicators for confirmation. Use RSI for momentum, moving averages for trend, Bollinger Bands for volatility, and volume for participation. Fourth, check broader market context. Fifth, define entry, stop-loss, target, and position size.
If price action and technical indicators disagree, wait. If both align and risk-reward is attractive, the setup may deserve attention.
This method keeps trading simple and disciplined.
Conclusion
Technical analysis vs price action is not a battle between two opposing methods. Price action is the foundation of chart reading. Technical analysis is the broader toolkit that includes indicators, patterns, volume, volatility, and trend tools.
Price action helps traders understand what price is doing directly. Technical indicators help confirm momentum, trend, and volatility. When traders combine both methods carefully, they can build a stronger trading process.
The best approach is simple. Read price first. Mark support and resistance. Study trend structure. Watch candlesticks. Then use indicators only for confirmation. Add market context, timing awareness, and strong risk management before entering a trade.
To continue learning and build a clearer market-reading process, read the full guide here: Technical Analysis vs Price Action: What Is the Difference?. Use it with the Financial Astrology Terminal, review global markets, build your watchlist, and trade with better structure before your next market decision.
메타데이터
- post_id
- 6e62c6d28593
- slug
- technical-analysis-vs-price-action-how-traders-choose-the-right-market-reading-method-6e62c6d28593
- url
- https://medium.com/@astroamazing/technical-analysis-vs-price-action-how-traders-choose-the-right-market-reading-method-6e62c6d28593
- canonical_url
- https://medium.com/@astroamazing/technical-analysis-vs-price-action-how-traders-choose-the-right-market-reading-method-6e62c6d28593
- author_url
- https://medium.com/@astroamazing
- status
- ok
- fetched_at
- 2026-06-09 15:37:30