How to Calculate MTTD/MTTA in Elasticsearch
Description
How to Calculate MTTD/MTTA in Elasticsearch
Description
There’s no native way to calculate MTTD (Mean Time To Detect). MTTD is the time between the alert creation and the analyst acknowledging the alert by changing the status of the alert from open to acknowledged, active, etc. To calculate it, we can run this ES query periodically to add the fields kibana.alert.workflow_status_first_updated_at and kibana.alert.workflow_update_time_diff
— kibana.alert.workflow_status_first_updated_at: The timestamp when the alert’s workflow status (e.g., closed or acknowledged) was first set.
— kibana.alert.workflow_update_time_diff: The time difference (in minutes) between the alert’s creation time and when its workflow status was first updated.
Steps to add
- Add these fields to the component template
.alerts-security.alerts-mappings—workflow_update_time_diff—workflow_status_first_updated_at - Go to Stack Management > Index Management > Component Templates > Filter for Managed > Search for and edit
.alerts-security.alerts-mappings
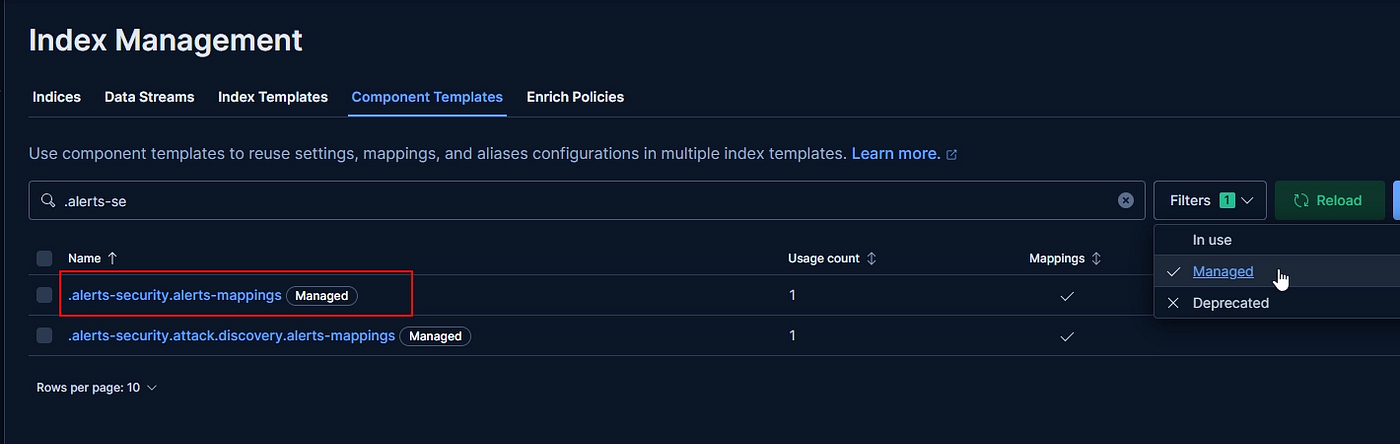
b. Go to the alert object and click on add property, scroll down, and add the fields


— workflow_update_time_diff is a numeric long type
— workflow_status_first_updated_at is a date type
2. Add these fields to the current index mappings as well by running this query in Dev Tools
PUT .alerts-security.alerts-default/_mapping
{
  "properties": {
    "kibana": {
      "properties": {
        "alert": {
          "properties": {
            "workflow_update_time_diff": {
              "type": "long"
            },
            "workflow_status_first_updated_at": {
              "type": "date"
            }
          }
        }
      }
    }
  }
}- You can test if the query is working and the fields are getting mapped by running this query, then checking the results in Discover
POST .alerts-security.alerts-default/_update_by_query
{
  "query": {
    "bool": {
      "must_not": {
        "exists": {
          "field": "kibana.alert.workflow_status_first_updated_at"
        }
      },
      "filter": [
        {
          "terms": {
            "kibana.alert.workflow_status": [
              "closed",
              "acknowledged"
            ]
          }
        },
        {
          "exists": {
            "field": "kibana.alert.workflow_status_updated_at"
          }
        }
      ]
    }
  },
  "script": {
    "source": """
    ctx._source['kibana.alert.workflow_status_first_updated_at'] =
    ctx._source['kibana.alert.workflow_status_updated_at'];

    Instant firstUpdated = Instant.parse(ctx._source['kibana.alert.workflow_status_updated_at']);

    Instant created = Instant.parse(ctx._source['@timestamp']);

    ctx._source['kibana.alert.workflow_update_time_diff'] =
    (firstUpdated.toEpochMilli() - created.toEpochMilli()) / 60000.0;
    """
  }
}- Now, we need this query to run automatically so it can capture the fields by itself. To do this, I suggest running a cron job with this query
curl -k -X POST -H “Authorization: ApiKey eFpNbDBKNEJzRzQ5MDZyOHA4WlM6Ym1hTzlnSEVaaEQ4TGhsSFpaaVJPZw==” -H “Content-Type: application/json” -d ‘{“query”:{“bool”:{“must_not”:{“exists”:{“field”:”kibana.alert.workflow_status_first_updated_at”}},”filter”:[{“terms”:{“kibana.alert.workflow_status”:[“acknowledged”, “closed”]}},{“exists”:{“field”:”kibana.alert.workflow_status_updated_at”}}]}},”script”:{“source”:”\r\n ctx._source[‘“‘“‘kibana.alert.workflow_status_first_updated_at’”’”’] =\r\n ctx._source[‘“‘“‘kibana.alert.workflow_status_updated_at’”’”’];\r\n\r\n Instant firstUpdated = Instant.parse(ctx._source[‘“‘“‘kibana.alert.workflow_status_updated_at’”’”’]);\r\n\r\n Instant created = Instant.parse(ctx._source[‘“‘“‘@timestamp’”’”’]);\r\n\r\n ctx._source[‘“‘“‘kibana.alert.workflow_update_time_diff’”’”’] =\r\n (firstUpdated.toEpochMilli() — created.toEpochMilli()) / 60000.0;\r\n “}}’ “https://127.0.0.1:9200/.alerts-security.alerts-default/_update_by_query”⚠️ Make sure the file is accessible to the user who will run the script automatically
- Put this in the crontab by running
crontab -e And then copy and paste this
*/1 * * * * /usr/bin/bash /opt/mttd_field_create.sh >/dev/null 2>&1-
Verify that the script is doing it work by changing the status of a field
-
To make the visualization, go to a visualization or a dashboard and add a visual
a. Add a visualization panel

b. We will be making a time chart. The horizontal axis will be the @timestamp. Add these options or change them as you like.

c. For the vertical axis, add these options

d. Choose the severity if you want. I will create a visualization for each severity level. You could add a layer for everyone to be in one visualization


Here’s how it could look

메타데이터
- post_id
- 7ea5f504a616
- slug
- how-to-calculate-mttd-mtta-in-elasticsearch-7ea5f504a616
- url
- https://medium.com/@yossifhelmy/how-to-calculate-mttd-mtta-in-elasticsearch-7ea5f504a616
- canonical_url
- https://medium.com/@yossifhelmy/how-to-calculate-mttd-mtta-in-elasticsearch-7ea5f504a616
- author_url
- https://medium.com/@yossifhelmy
- status
- ok
- fetched_at
- 2026-06-20 20:29:01