Star Schema Explained: How Fact and Dimension Tables Work Together
If you’ve ever opened a data warehouse and seen tables with names like:
Star Schema Explained: How Fact and Dimension Tables Work Together
If you’ve ever opened a data warehouse and seen tables with names like:
fact_sales
dim_customer
dim_product
dim_date
you’ve probably encountered a star schema.
The name sounds more complicated than the idea actually is.
At its core, a star schema is simply a way of organizing data so that business questions become easier to answer.
The basic structure is:
One central fact table
surrounded by
multiple dimension tables.
The result looks a little like a star.
And once you understand why this structure exists, dimensional modeling becomes much easier to reason about.
What Is a Star Schema?
A star schema is a data modeling pattern commonly used in analytical systems and data warehouses.
At the center is a fact table.
Around it are dimension tables.
For example, imagine an e-commerce company.
The business wants to analyze sales.
The central fact table could be:
Fact Sales
- Order ID
- Customer ID
- Product ID
- Date ID
- Store ID
- Quantity
- Sales Amount
- Discount
And around it we might have:
Dim Customer
Dim Product
Dim Date
Dim Store
The structure looks like this:
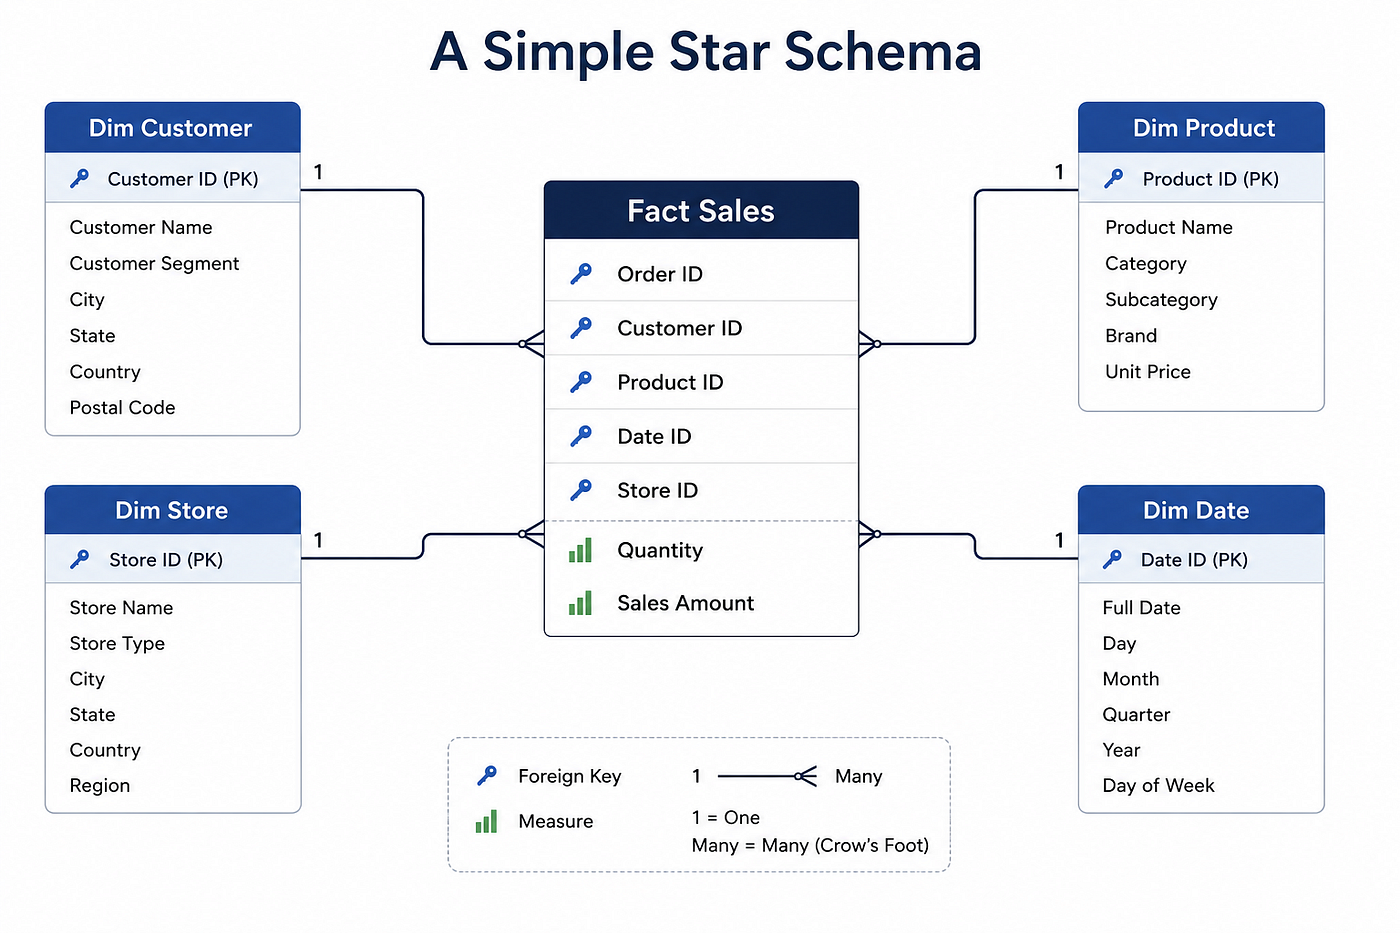
Simple Star Schema
The fact table records the business events.
The dimensions provide the context.
That’s the basic idea.
Why Is It Called a “Star” Schema?
The name comes from the shape of the model.
The fact table sits in the middle.
Dimension tables surround it.
For example:
                Dim Customer
                       |
                       |
Dim Product ---- Fact Sales ---- Dim Date
                       |
                       |
                   Dim Store
If you draw the relationships, it resembles a star.
The name isn’t important by itself.
What matters is why the structure is useful.
The Fact Table Is the Center of the Model
Let’s return to our e-commerce example.
Suppose a customer purchases a laptop.
The fact table records the event.
A simplified record might contain:
Customer ID: 45
Product ID: 210
Date ID: 20260805
Store ID: 12
Quantity: 2
Sales Amount: $1,200
Notice something important.
The fact table doesn’t need to store everything about the customer.
It doesn’t need to repeat:
Customer Name: Sarah
City: Houston
State: Texas
Instead, it stores the customer’s key.
Customer ID = 45
That key connects the event to the customer dimension.
Dimensions Provide the Context
The dimension tables tell us more about the event.
For example:
Dim Customer
Customer ID: 45
Customer Name: Sarah
City: Houston
State: Texas
Customer Segment: Gold
Now we can answer questions such as:
How much did Gold customers spend?
Or:
How much revenue came from customers in Texas?
The fact table gives us the measurement.
The dimension gives us the context.
This separation is one of the most important ideas behind dimensional modeling.
Why Not Put Everything in One Table?
This is a natural question.
Why not simply create one large table containing:
- Customer Name
- Customer City
- Product Name
- Product Category
- Store
- Date
- Quantity
- Revenue
At first, this seems easier.
But imagine the company has hundreds of millions of sales records.
The same customer information could be repeated thousands of times.
The same product information could be repeated millions of times.
The same store information could be repeated again and again.
That creates unnecessary duplication.
A star schema separates the business event from the descriptive information around that event.
Instead of repeating:
“Laptop, Electronics, Dell”
on every transaction, we store the product information once in the product dimension and reference it through a key.
The Role of Keys
This is where keys become important.
The fact table typically contains foreign keys that point to dimensions.
For example:
Fact SalesCustomer ID → Dim Customer
Product ID → Dim Product
Date ID → Dim Date
Store ID → Dim StoreThe fact table uses these keys to connect the event to its context.
This means a query can combine the information when needed.
For example:
“Show revenue by product category.”
The database can use:
Fact Sales → Product ID → Dim Product → Category
and aggregate the sales amount by category.
A Business Question Becomes a Data Query
This is where star schemas become particularly useful.
Imagine the business asks:
What was our total revenue for laptops sold to Gold customers in Texas during Q3?
That sounds like a complicated question.
But look at the model.
We need:
Fact Sales
for the revenue.
Dim Product
for the product category.
Dim Customer
for the customer segment and location.
Dim Date
for the quarter.
The model gives each piece of the question a logical home.
That’s one of the biggest advantages of dimensional modeling.
Business questions can be translated into data queries without having to understand every operational system behind the data.

From Business Question to Revenue Model
The Importance of Grain
There’s another concept that should always be considered when designing a star schema:
Grain.
Grain answers:
What does one row in the fact table represent?
For example:
One row = one order
or:
One row = one order line
Those are not the same thing.
Suppose Order 1001 contains:
- Laptop
- Mouse
- Keyboard
If the grain is one order, there may be one fact row.
If the grain is one order line, there will be three fact rows.
Both designs can be valid.
But they answer different questions.
That’s why the grain should be defined before the fact table is designed.
Star Schema vs. One Giant Table
Let’s compare the two approaches.
One Giant Table
Everything is stored together.
Customer attributes.
Product attributes.
Store attributes.
Transaction data.
This can become difficult to maintain as the data grows.
Star Schema
The event is stored in the fact table.
The descriptive information is stored in dimensions.
This creates a cleaner separation of responsibilities.
The structure becomes easier to understand:
Business Event
      ↓
Fact Table
      ↓
Business Context
      ↓
Dimensions
Star Schema vs. Snowflake Schema
You may also hear about snowflake schemas.
The key difference is that a snowflake schema typically normalizes some of the dimension structures into additional related tables.
For example, instead of:
Dim ProductProduct
Category
Subcategory
Brandyou might have:
Dim Product
      ↓
Dim Category
      ↓
Dim Brand
This creates more relationships.
A star schema generally keeps dimensions flatter and easier to query.
A snowflake schema introduces additional normalization.
Neither is universally “correct.”
The right choice depends on the business requirements, data characteristics, performance considerations, and platform.

Why Star Schemas Work So Well for Analytics
Analytical workloads are different from transactional workloads.
A transactional system might ask:
“Update this customer’s address.”
An analytical system might ask:
“Show revenue by customer segment, region, product category, and quarter.”
These workloads have different needs.
Star schemas are designed around analytical questions.
They make it relatively straightforward to:
- Filter by dimensions
- Aggregate facts
- Slice and dice metrics
- Build BI reports
- Create reusable semantic models
That’s why star schemas remain such an important concept in data warehousing.
Star Schema in a Modern Data Platform
Star schemas aren’t limited to traditional data warehouses.
The same modeling principles can appear in modern lakehouse environments.
A simplified architecture might look like:
Raw Data
   ↓
Bronze
   ↓
Silver
   ↓
Gold
   ↓
Fact + Dimension Models
   ↓
Semantic Layer
   ↓
BI / Analytics
The underlying technologies may change.
The modeling principles don’t necessarily disappear.
Whether you’re working with a traditional warehouse, a cloud data platform, or a lakehouse architecture, the same questions still matter:
What happened?
What does one row represent?
What context do we need?
How will the business consume this data?
Common Star Schema Mistakes
A star schema can still be poorly designed.
Here are some mistakes worth watching for.
1. Not defining the grain
If you don’t know what one row represents, your fact table can become ambiguous.
2. Putting too much descriptive information in the fact
The fact should focus on the business event and its measures.
3. Creating dimensions without a business purpose
Not every attribute needs its own dimension.
4. Overcomplicating the model
More tables don’t automatically mean better architecture.
5. Ignoring how the data will be queried
A model should support the business questions it is intended to answer.
The goal isn’t to build the most sophisticated schema.
The goal is to build a model that is understandable, maintainable, and useful.
How I Think About Star Schemas
When designing a star schema, I like to work backward from the business question.
Start with:
What does the business want to know?
Then ask:
What event produces that metric?
That becomes the fact.
Then ask:
What context does the business need to analyze that event?
Those become the dimensions.
Then ask:
What does one row represent?
That’s the grain.
And finally:
How will this model be consumed?
Dashboards?
Reports?
Semantic models?
Machine learning?
Data products?
The answers influence the final design.
A Simple Mental Model
If you’re new to dimensional modeling, remember this:
Fact table = What happened
Dimension tables = Context
Grain = What one row represents
Star schema = Facts connected to their dimensions
That’s the entire concept in four lines.
The rest is implementation detail.
Final Thoughts
Star schemas aren’t valuable because they look like stars.
They’re valuable because they provide a simple way to organize analytical data around business events and business context.
A sale happens.
The fact table records it.
The dimensions tell us:
Who bought it.
What they bought.
Where they bought it.
When they bought it.
Once those relationships are modeled clearly, a large number of business questions become much easier to answer.
And that’s ultimately what good data modeling should accomplish.
Not more tables.
Not more complexity.
Better questions. Better answers.
메타데이터
- post_id
- 9f4985cf145a
- slug
- star-schema-explained-how-fact-and-dimension-tables-work-together-9f4985cf145a
- url
- https://medium.com/@pchandrika0613/star-schema-explained-how-fact-and-dimension-tables-work-together-9f4985cf145a
- canonical_url
- https://medium.com/@pchandrika0613/star-schema-explained-how-fact-and-dimension-tables-work-together-9f4985cf145a
- author_url
- https://medium.com/@pchandrika0613
- status
- ok
- fetched_at
- 2026-08-18 11:40:50




