Building a Linux System Monitor in C++ — Part3 (Per-process and CPU calculations)
Processor & Process deep dive (with NCurses visualization)
Building a Linux System Monitor in C++ — Part3 (Per-process and CPU calculations)
Processor & Process deep dive (with NCurses visualization)
Building a Linux System Monitor in C++ — Part1
Builing a Linux System Monitor in C++ — Part2
In Parts 1–2 we read /proc and built the System + LinuxParser facade. Now we implement the pieces that actually compute utilization metrics:
Processor— aggregate CPU utilizationProcess— per-PID CPU, memory, uptime, command, and user- brief: how the
NCursesDisplayconsumesSystemto render a live UI
Recap: why delta (difference) matters
/proc/stat and /proc/[pid]/stat expose cumulative counters since boot (in jiffies/clock ticks). If you compute utilization from a single sample, you get a long-term average. To reflect the current load, use:
delta_active = active_now - active_prev
delta_total = total_now - total_prev
utilization = delta_active / delta_total
So Processor must store previous totals across calls — that’s why System::Cpu() returns a reference to the single Processor instance.
Processor implementation (delta-based CPU utilization)
header (key parts)
#ifndef PROCESSOR_H
#define PROCESSOR_H

#include <vector>

class Processor {
   public:
      float Utilization(); // Return aggregate CPU utilization
   private:
   // previous snapshot
   long prevActive_{0};
   long prevIdle_{0};
   long prevTotal_{0};
};

#endif
processor.cpp key logic is as follows.
#include "processor.h"
#include "linux_parser.h"

float Processor::Utilization() {
   // current snapshot
   long active = LinuxParser::ActiveJiffies();
   long idle = LinuxParser::IdleJiffies();
   long total = active +idle;

   // deltas
   long deltaActive = active - prevActive_;
   long deltaTotal = total - prevTotal_;

   // update previous snapshot for next call
   prevActive_ = active;
   prevIdle_ = idle;
   prevTotal_ = total;

   if (deltaTotal == 0) return 0.0f;
   return static_cast<float>(deltaActive) / static_cast<float>(deltaTotal);
}LinuxParser::ActiveJiffies()andIdleJiffies()return jiffies (Linux internal time units). Since we compute a ratio (active/total), unit conversion (to seconds) cancels out — no need forsysconf(_SC_CLK_TCK)here.- The first call will have
prev*zeroed;deltaTotalcould equaltotaland still produce a valid snapshot. Many implementations ignore the first sample or seedprev*by reading once during initialization. - Returning
floatis fine for UI percentages; if you need higher precision, usedouble.
Process implementation — parsing per-process stat and computing CPU
Each Process object wraps /proc/[pid] info. Key responsibilities:
- Read
/proc/[pid]/stat(CPU times andstarttime) - Read
/proc/[pid]/status(memory, Uid) - Read
/proc/[pid]/cmdline(command) - Compute per-process CPU usage as (total_time_seconds / process_lifetime_seconds)
header (constructor + members)
#ifndef PROCESS_H
#define PROCESS_H

#include <string>

class Process {
   public:
      Process(int pid) : pid_(pid) {}

      int Pid();
      std::string User();
      std::string Command();
      float CpuUtilization();
      std::string Ram();
      long int UpTime();
      bool operator<(Process const& a) const;

   private:
      int pid_;
      float cpuUtilization_{0.0};
};

#endif
key methods (essentials)
int Process::Pid() { return pid_; }

float Process::CpuUtilization() {
   long total_time = LinuxParser::ActiveJiffies(pid_); // utime+stime+cutime+cstime (raw jiffies)
   long uptime = LinuxParser::UpTime(); // system uptime in seconds
   long starttime = LinuxParser::UpTime(pid_); // process start (seconds since boot)
   long hertz = sysconf(_SC_CLK_TCK);

   // process elapsed time in seconds
   float seconds = static_cast<float>(uptime - starttime);
   if (seconds <= 0) {
      cpuUtilization_ = 0.0;
      return cpuUtilization_;
   }
   // convert jiffies -> seconds: total_time / hertz
   cpuUtilization_ = ((float)total_time / hertz) / seconds;
   return cpuUtilization_;
}

std::string Process::Command() {
   string cmd = LinuxParser::Command(pid_);
   if (cmd.size() > 40) cmd = cmd.substr(0, 40) + "...";
   return cmd;

std::string Process::Ram() {
   string ram = LinuxParser::Ram(pid_);
   return ram.empty() ? "0" : ram;
}

std::Process::User() { return LinuxParser::User(pid_); }

long int Process::UpTime() { return LinuxParser::UpTime(pid_); }

bool Process::operator<(Process const& a) const {
   return this->cpuUtilization_ > a.cpuUtilization_; // descending by CPU
}
Why this formula?
/proc/[pid]/stat gives four per-process time fields in clock ticks:
utime(user),stime(kernel),cutime,cstime. Sum them -> total jiffies spent by process.starttimeis the clock-tick timestamp when the process started (since boot).- Convert ticks to seconds:
seconds = ticks / sysconf(_SC_CLK_TCK). - Process lifetime (seconds) =
system_uptime — starttime_in_seconds. - Average CPU usage since process start =
(total_time_seconds) / lifetime_seconds).
This yields a per-process average since the process started — not a short-term rate. Also remember to strip pid and the (comm) field before indexing tokens in /proc/[pid]/stat because comm may contain spaces. The shared LinuxParser handled that by locating '(' and ')' and taking the substring after the ') ' — a robust approach to preserve field indices.
Sorting process & operator<
System::Process() constructs Process(pid) objects and calls std::sort(process_.begin(), process_.end());.
Process::operator< returns true when this->cpuUtilization_ > a.cpuUtilization_, meaning std::sort will place the highest CPU consumers first.
NCurses visualization (how it ties together)
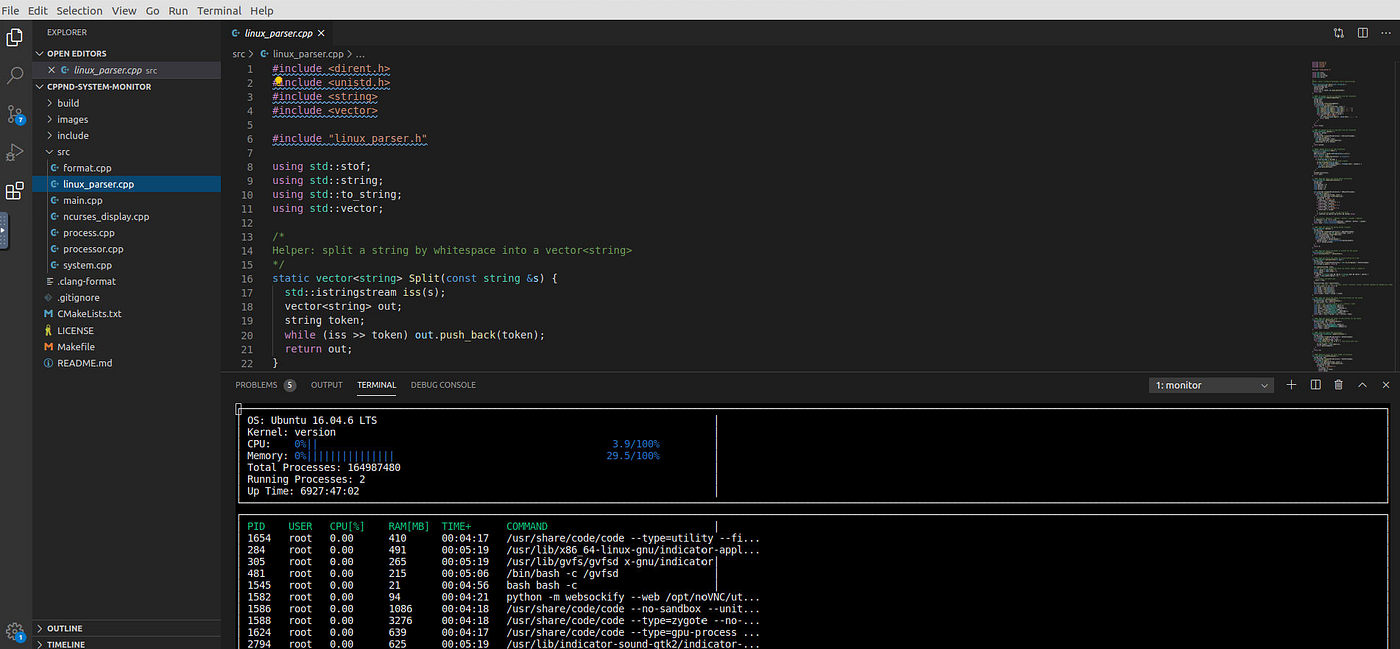
The NCurseDisplay module (starter code provided by Udacity) repeatedly calls into System and draws the UI. NCursesDisplay expects System to be inexpensive to call and to reflect current data. The UI draws a header (OS, Kernel, CPU bar, Mem bar, Uptime) and a table of processes (PID, USER, CPU%, MEM MB, TIME, COMMAND).
Conclusion
The project can be taken even further by adding short-term per-process CPU calculations using deltas, generating per-core CPU breakdowns. Additional refinements such as improved formatting, or smoothing algorithms for CPU bars can enhance overall polish.
Ultimately, this project brings together several disciplines:
- Linux systems internals through the
/procfilesystem - C++ class design and parsing
- Live terminal interface built with
ncursesto form a complete, functioning system monitor.
By implementing Processor, Process, and System in concert and feeding their data into the display loop, you construct a real-time, extensible visualization of system activity that reflects both strong engineering practices and a deep understanding of how Linux exposes runtime information.
메타데이터
- post_id
- a0d4a90300b0
- slug
- building-a-linux-system-monitor-in-c-part3-per-process-and-cpu-calculations-a0d4a90300b0
- url
- https://medium.com/@su-paris/building-a-linux-system-monitor-in-c-part3-per-process-and-cpu-calculations-a0d4a90300b0
- canonical_url
- https://medium.com/@su-paris/building-a-linux-system-monitor-in-c-part3-per-process-and-cpu-calculations-a0d4a90300b0
- author_url
- https://medium.com/@su-paris
- status
- ok
- fetched_at
- 2026-07-24 02:42:35



