Polyglot Application Distributed Tracing With OpenTelemetry
A hands-on observability demo that showcases end-to-end distributed tracing across four microservices built with different technology…
Polyglot Application Distributed Tracing With OpenTelemetry and Jaeger
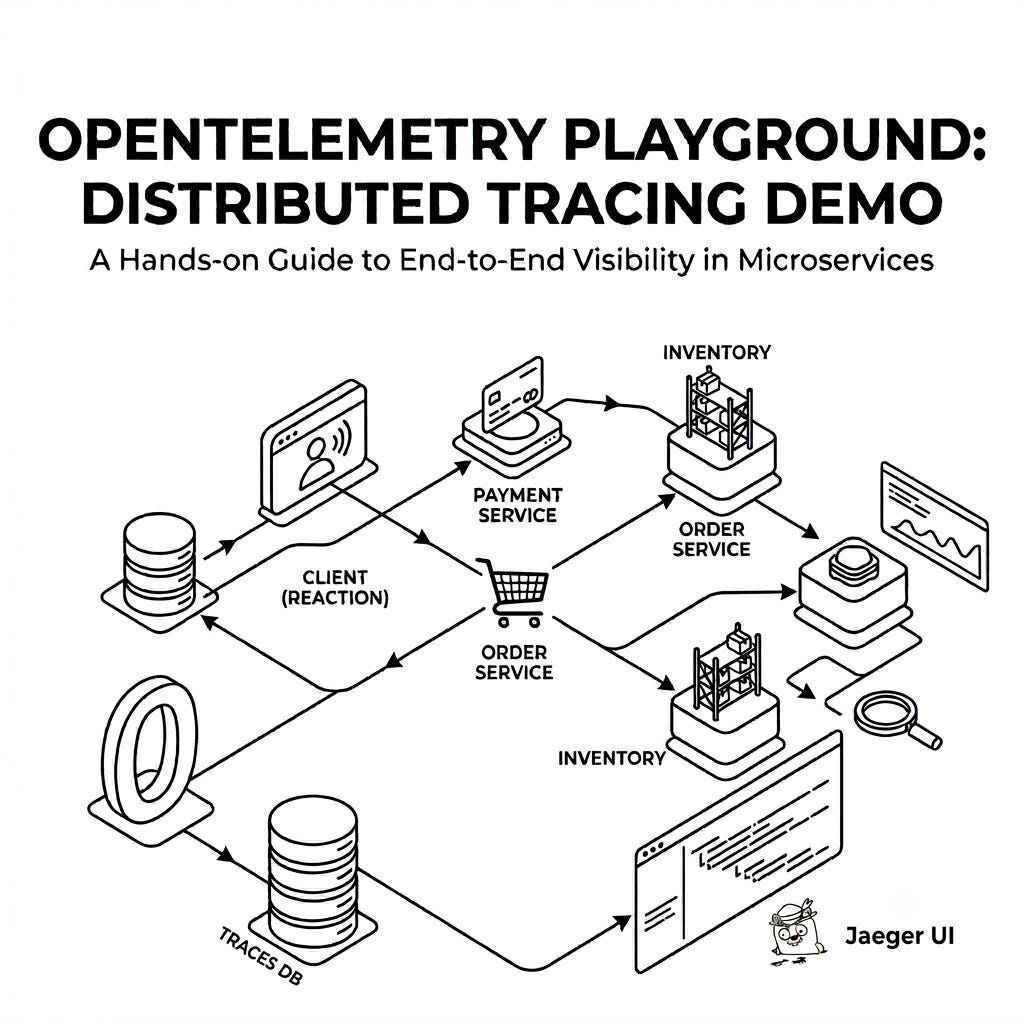
A hands-on observability demo that showcases end-to-end distributed tracing across four microservices built with different technology stacks — React, Spring Boot (Java), FastAPI (Python), and Express (Node.js) — all wired together using OpenTelemetry and visualized in Jaeger.
When you click the “Fire Microservice Cascade” button in the React UI, a single request cascades through all four services, and a correlated distributed trace appears in Jaeger — proving that context propagation works across language and layer boundaries.
📋 Table of Contents
- Required Tools & Software
- Application Architecture
- Project Structure
- File Contents
- Running the Application
- Testing the Application
- Debugging Potential Issues
- Clean Up Resources
- Note
🔧 Required Tools & Software
1. Homebrew
Homebrew is the package manager for macOS. Install it first as other tools depend on it.
/bin/bash -c "$(curl -fsSL https://raw.githubusercontent.com/Homebrew/install/HEAD/install.sh)"After installation, verify:
brew --version2. Docker Desktop for Mac
Docker Desktop is required to build and run all containerized services.
Install via Homebrew:
brew install --cask dockerThen open Docker Desktop from your Applications folder. Ensure it is running before proceeding. You should see the Docker icon in your menu bar.
Verify installation:
docker --version
docker compose version
Note for Apple Silicon (M1/M2/M3): Docker Desktop natively supports Apple Silicon. Make sure you are running Docker Desktop version 4.x or later for best compatibility.
3. Git
brew install gitVerify:
git --version4. cURL (Pre-installed on macOS)
cURL is pre-installed on macOS. Verify it is available:
curl --version🏗️ Application Architecture
The application consists of 6 services orchestrated via Docker Compose. Four are application microservices that form a trace cascade, and two are observability backends.
Logical Flow Diagram
┌──────────────────────────────────────────────────────────────────────────────────┐
│                          OBSERVABILITY PLAYGROUND                                │
│                                                                                  │
│   ┌──────────────────────────────────────────────────────────────────────────┐    │
│   │                        TRACE CASCADE FLOW                               │    │
│   │                                                                          │    │
│   │   ┌──────────────┐     ┌──────────────┐     ┌──────────────┐            │    │
│   │   │              │     │              │     │              │            │    │
│   │   │    React     │────▶│  Spring Boot │────▶│    Python    │            │    │
│   │   │   Frontend   │     │  API Gateway │     │  FastAPI     │            │    │
│   │   │   (Port 3001)│     │  (Port 8080) │     │  (Port 8000) │            │    │
│   │   │              │     │              │     │              │            │    │
│   │   └──────────────┘     └──────────────┘     └──────┬───────┘            │    │
│   │                                                     │                    │    │
│   │                                                     ▼                    │    │
│   │                                              ┌──────────────┐            │    │
│   │                                              │              │            │    │
│   │                                              │   Node.js    │            │    │
│   │                                              │   Express    │            │    │
│   │                                              │  (Port 5002) │            │    │
│   │                                              │              │            │    │
│   │                                              └──────────────┘            │    │
│   └──────────────────────────────────────────────────────────────────────────┘    │
│                                                                                  │
│   ┌──────────────────────────────────────────────────────────────────────────┐    │
│   │                    OBSERVABILITY PIPELINE                                │    │
│   │                                                                          │    │
│   │   All services ──────▶ OTel Collector ──────▶ Jaeger UI                 │    │
│   │                    (OTLP gRPC/HTTP)          (Port 16686)               │    │
│   └──────────────────────────────────────────────────────────────────────────┘    │
│                                                                                  │
└──────────────────────────────────────────────────────────────────────────────────┘
Service Communication Flow (Text Line Diagram)
Browser (Mac) ──HTTP──▶ React Frontend (3001)
                            │
                            │ fetch('http://localhost:8080/api/start')
                            ▼
                        Spring Boot API Gateway (8080)
                            │
                            │ HTTP call to http://python-service:8000/process
                            ▼
                        Python FastAPI Service (8000)
                            │
                            │ HTTP call to http://node-service:5000/finalize
                            ▼
                        Node.js Express Service (5000)
All 4 services ──OTLP──▶ OpenTelemetry Collector (4317/4318) ──▶ Jaeger (16686)📁 Project Structure
opentelemetry-playground/
├── docker-compose.yml                  # Orchestrates all 6 services
├── otel-collector-config.yaml          # OpenTelemetry Collector configuration
├── .gitignore                          # Git ignore rules
├── README.md                           # This file
│
├── react-frontend/                     # React UI (triggers the cascade)
│   ├── Dockerfile
│   ├── package.json
│   ├── public/
│   │   └── index.html
│   └── src/
│       ├── index.js                    # Entry point (loads tracing first)
│       ├── App.js                      # UI component with "Fire Cascade" button
│       └── tracing.js                  # OpenTelemetry web tracing setup
│
├── spring-boot-api/                    # Java Spring Boot API Gateway
│   ├── Dockerfile                      # Multi-stage build with OTel Java agent
│   ├── pom.xml                         # Maven dependencies (Spring Boot 3.2.3)
│   └── src/main/java/com/example/demo/
│       └── DemoApplication.java        # Gateway controller, calls Python service
│
├── python-service/                     # Python FastAPI microservice
│   ├── Dockerfile
│   ├── requirements.txt
│   └── app.py                          # FastAPI app, calls Node.js service
│
└── node-service/                       # Node.js Express terminal service
    ├── Dockerfile
    ├── package.json
    ├── server.js                       # Express app, returns final response
    └── tracing.js                      # OpenTelemetry Node SDK setup
📄 File Contents
docker-compose.yml
version: '3.8'services:
jaeger:
image: jaegertracing/all-in-one:latest
ports:
- "16686:16686" # Jaeger UI on your Mac browser
networks:
- otel-network otel-collector:
image: otel/opentelemetry-collector-contrib:latest
volumes:
- ./otel-collector-config.yaml:/etc/otelcol/config.yaml
command: ["--config=/etc/otelcol/config.yaml"]
ports:
- "4317:4317" # OTLP gRPC (Internal network backend tracking)
- "4318:4318" # OTLP HTTP (Exposed to your Mac for React Frontend)
depends_on:
- jaeger
networks:
- otel-network react-frontend:
build: ./react-frontend
ports:
- "3001:3000" # React UI on your Mac browser
networks:
- otel-network spring-boot-api:
build: ./spring-boot-api
ports:
- "8080:8080"
environment:
- OTEL_SERVICE_NAME=spring-boot-api
- OTEL_EXPORTER_OTLP_ENDPOINT=http://otel-collector:4318
- OTEL_TRACES_EXPORTER=otlp
- OTEL_METRICS_EXPORTER=none
- OTEL_LOGS_EXPORTER=none
depends_on:
- otel-collector
networks:
- otel-network python-service:
build: ./python-service
ports:
- "8000:8000"
environment:
- OTEL_SERVICE_NAME=python-service
depends_on:
- otel-collector
networks:
- otel-network node-service:
build: ./node-service
ports:
- "5002:5000" # Maps port 5002 on your Mac to 5000 inside the container
depends_on:
- otel-collector
networks:
- otel-networknetworks:
otel-network:
driver: bridgeotel-collector-config.yaml
receivers:
  otlp:
    protocols:
      grpc:
        endpoint: 0.0.0.0:4317
      http:
        endpoint: 0.0.0.0:4318
        cors:
          allowed_origins: ["http://localhost:3001"]
exporters:
otlp/jaeger:
endpoint: "jaeger:4317"
tls:
insecure: trueprocessors:
batch:service:
pipelines:
traces:
receivers: [otlp]
processors: [batch]
exporters: [otlp/jaeger]react-frontend/package.json
{
  "name": "react-frontend",
  "version": "0.1.0",
  "private": true,
  "dependencies": {
    "@opentelemetry/api": "^1.9.0",
    "@opentelemetry/context-zone": "^1.30.0",
    "@opentelemetry/exporter-trace-otlp-http": "^0.57.0",
    "@opentelemetry/instrumentation-fetch": "^0.57.0",
    "@opentelemetry/sdk-trace-web": "^1.30.0",
    "@opentelemetry/resources": "^1.30.0",
    "@opentelemetry/semantic-conventions": "^1.28.0",
    "react": "^18.2.0",
    "react-dom": "^18.2.0",
    "react-scripts": "5.0.1"
  },
  "scripts": {
    "start": "BROWSER=none react-scripts start"
  }
}
react-frontend/Dockerfile
FROM node:18-alpine
WORKDIR /app
COPY package.json ./
RUN npm install
COPY . .
EXPOSE 3000
CMD ["npm", "start"]
react-frontend/public/index.html
<!DOCTYPE html>
<html lang="en">
  <head>
    <meta charset="utf-8" />
    <meta name="viewport" content="width=device-width, initial-scale=1" />
    <title>Observability Playground</title>
  </head>
  <body>
    <noscript>You need to enable JavaScript to run this app.</noscript>
    <div id="root"></div>
  </body>
</html>
react-frontend/src/index.js
import './tracing'; // Must be the absolute first import!
import React from 'react';
import ReactDOM from 'react-dom/client';
import App from './App';
const root = ReactDOM.createRoot(document.getElementById('root'));
root.render(
<React.StrictMode>
<App />
</React.StrictMode>
);react-frontend/src/tracing.js
import { WebTracerProvider } from '@opentelemetry/sdk-trace-web';
import { BatchSpanProcessor } from '@opentelemetry/sdk-trace-base';
import { OTLPTraceExporter } from '@opentelemetry/exporter-trace-otlp-http';
import { registerInstrumentations } from '@opentelemetry/instrumentation';
import { FetchInstrumentation } from '@opentelemetry/instrumentation-fetch';
import { ZoneContextManager } from '@opentelemetry/context-zone';
import { Resource } from '@opentelemetry/resources';
import { ATTR_SERVICE_NAME } from '@opentelemetry/semantic-conventions';
const provider = new WebTracerProvider({
resource: new Resource({
[ATTR_SERVICE_NAME]: 'react-frontend',
}),
});const exporter = new OTLPTraceExporter({
url: 'http://localhost:4318/v1/traces',
});provider.addSpanProcessor(new BatchSpanProcessor(exporter));
provider.register({
contextManager: new ZoneContextManager(),
});registerInstrumentations({
instrumentations: [
new FetchInstrumentation({
propagateTraceHeaderCorsUrls: [ /localhost:8080/ ],
}),
],
});react-frontend/src/App.js
import React, { useState } from 'react';function App() {
const [data, setData] = useState(null);
const [loading, setLoading] = useState(false);
const [error, setError] = useState(null); const fireCascade = async () => {
setLoading(true);
setError(null);
setData(null); try {
const response = await fetch('http://localhost:8080/api/start'); if (!response.ok) {
throw new Error(`Server responded with status ${response.status}`);
} const json = await response.json();
setData(json);
} catch (err) {
console.error("Cascade execution failed:", err);
setError(err.message || "An unexpected error occurred in the network chain.");
} finally {
setLoading(false);
}
}; return (
<div style={styles.container}>
<header style={styles.header}>
<h1>⚡ Observability Playground ⚡</h1>
<p>Trigger an end-to-end distributed trace across React, Java, Python, and Node.js.</p>
</header> <main style={styles.main}>
<button
onClick={fireCascade}
disabled={loading}
style={{
...styles.button,
...(loading ? styles.buttonDisabled : {})
}}
>
{loading ? 'Dropping Telemetry Spans...' : 'Fire Microservice Cascade 🚀'}
</button> <div style={styles.outputContainer}>
{loading && (
<div style={styles.loadingBox}>
<div style={styles.spinner}></div>
<p>Traversing network layers: React ➔ Spring Boot ➔ FastAPI ➔ Express...</p>
</div>
)} {error && (
<div style={styles.errorBox}>
<h3>❌ Cascade Blocked</h3>
<p>{error}</p>
</div>
)} {data && (
<div style={styles.successBox}>
<div style={styles.successHeader}>
<span>✅ Request Chain Successful!</span>
<span style={styles.badge}>200 OK</span>
</div>
<p style={styles.successText}>
The downstream microservices processed the token chain successfully.
Check your Jaeger dashboard to see the matching distributed trace!
</p>
<pre style={styles.jsonBlock}>
{JSON.stringify(data, null, 2)}
</pre>
</div>
)}
</div>
</main>
</div>
);
}const styles = {
container: {
fontFamily: '-apple-system, BlinkMacSystemFont, "Segoe UI", Roboto, sans-serif',
backgroundColor: '#0f172a',
color: '#f8fafc',
minHeight: '100vh',
padding: '2rem',
display: 'flex',
flexDirection: 'column',
alignItems: 'center',
},
header: {
textAlign: 'center',
marginBottom: '2rem',
},
main: {
width: '100%',
maxWidth: '650px',
display: 'flex',
flexDirection: 'column',
alignItems: 'center',
},
button: {
backgroundColor: '#3b82f6',
color: '#ffffff',
border: 'none',
padding: '0.75rem 1.5rem',
fontSize: '1.1rem',
fontWeight: 'bold',
borderRadius: '6px',
cursor: 'pointer',
transition: 'background-color 0.2s',
boxShadow: '0 4px 6px -1px rgba(59, 130, 246, 0.3)',
},
buttonDisabled: {
backgroundColor: '#475569',
cursor: 'not-allowed',
boxShadow: 'none',
},
outputContainer: {
marginTop: '2rem',
width: '100%',
},
loadingBox: {
textAlign: 'center',
color: '#94a3b8',
padding: '1.5rem',
},
errorBox: {
backgroundColor: '#451a03',
border: '1px solid #7f1d1d',
borderRadius: '8px',
padding: '1.25rem',
color: '#fca5a5',
},
successBox: {
backgroundColor: '#022c22',
border: '1px solid #064e3b',
borderRadius: '8px',
padding: '1.5rem',
boxShadow: '0 10px 15px -3px rgba(0, 0, 0, 0.3)',
},
successHeader: {
display: 'flex',
justifyContent: 'space-between',
alignItems: 'center',
fontWeight: 'bold',
color: '#34d399',
fontSize: '1.1rem',
},
badge: {
backgroundColor: '#047857',
color: '#fff',
padding: '0.2rem 0.5rem',
borderRadius: '4px',
fontSize: '0.8rem',
},
successText: {
color: '#a7f3d0',
fontSize: '0.95rem',
margin: '0.75rem 0 1.2rem 0',
lineHeight: '1.4',
},
jsonBlock: {
backgroundColor: '#090d16',
padding: '1rem',
borderRadius: '6px',
overflowX: 'auto',
color: '#38bdf8',
fontSize: '0.85rem',
border: '1px solid #1e293b',
}
};export default App;spring-boot-api/Dockerfile
# Stage 1: Build the App and Fetch Agent
FROM maven:3.9-eclipse-temurin-17 AS build
WORKDIR /app
COPY pom.xml .
RUN mvn dependency:go-offline
COPY src ./src
RUN mvn clean package -DskipTests
RUN curl -L -o opentelemetry-javaagent.jar \
  https://github.com/open-telemetry/opentelemetry-java-instrumentation/releases/latest/download/opentelemetry-javaagent.jar
# Stage 2: Runtime Environment
FROM eclipse-temurin:17-jre-jammy
WORKDIR /app
COPY --from=build /app/target/demo-0.0.1-SNAPSHOT.jar app.jar
COPY --from=build /app/opentelemetry-javaagent.jar opentelemetry-javaagent.jarEXPOSE 8080
ENTRYPOINT ["java", "-javaagent:opentelemetry-javaagent.jar", "-jar", "app.jar"]spring-boot-api/pom.xml
<?xml version="1.0" encoding="UTF-8"?>
<project xmlns="http://maven.apache.org/POM/4.0.0"
         xmlns:xsi="http://www.w3.org/2001/XMLSchema-instance"
         xsi:schemaLocation="http://maven.apache.org/POM/4.0.0
         https://maven.apache.org/xsd/maven-4.0.0.xsd">
    <modelVersion>4.0.0</modelVersion>
    <parent>
        <groupId>org.springframework.boot</groupId>
        <artifactId>spring-boot-starter-parent</artifactId>
        <version>3.2.3</version>
    </parent>
    <groupId>com.example</groupId>
    <artifactId>demo</artifactId>
    <version>0.0.1-SNAPSHOT</version>
    <dependencies>
        <dependency>
            <groupId>org.springframework.boot</groupId>
            <artifactId>spring-boot-starter-web</artifactId>
        </dependency>
    </dependencies>
<build>
<plugins>
<plugin>
<groupId>org.springframework.boot</groupId>
<artifactId>spring-boot-maven-plugin</artifactId>
</plugin>
</plugins>
</build>
</project>spring-boot-api/src/main/java/com/example/demo/DemoApplication.java
package com.example.demo;import org.springframework.boot.SpringApplication;
import org.springframework.boot.autoconfigure.SpringBootApplication;
import org.springframework.web.bind.annotation.CrossOrigin;
import org.springframework.web.bind.annotation.GetMapping;
import org.springframework.web.bind.annotation.RestController;
import org.springframework.web.client.RestTemplate;
import java.util.Map;@SpringBootApplication
public class DemoApplication {
public static void main(String[] args) {
SpringApplication.run(DemoApplication.class, args);
}
}@RestController
@CrossOrigin(origins = "*")
class GatewayController { private final RestTemplate restTemplate = new RestTemplate(); @GetMapping("/api/start")
public Map<String, Object> startPipeline() {
String pythonUrl = "http://python-service:8000/process";
Map<String, Object> pythonResponse = restTemplate.getForObject(pythonUrl, Map.class); return Map.of(
"layer", "Spring Boot API Gateway",
"downstream", pythonResponse
);
}
}python-service/Dockerfile
FROM python:3.11-slim
WORKDIR /app
COPY requirements.txt .
RUN pip install --no-cache-dir -r requirements.txt
COPY app.py .
EXPOSE 8000
CMD ["python", "app.py"]
python-service/requirements.txt
fastapi
uvicorn
requests
opentelemetry-api
opentelemetry-sdk
opentelemetry-exporter-otlp
opentelemetry-instrumentation-fastapi
opentelemetry-instrumentation-requests
python-service/app.py
import uvicorn
from fastapi import FastAPI
import requests
from opentelemetry import trace
from opentelemetry.sdk.trace import TracerProvider
from opentelemetry.sdk.trace.export import BatchSpanProcessor
from opentelemetry.exporter.otlp.proto.grpc.trace_exporter import OTLPSpanExporter
from opentelemetry.sdk.resources import Resourceresource = Resource(attributes={"service.name": "python-service"})
provider = TracerProvider(resource=resource)
processor = BatchSpanProcessor(OTLPSpanExporter(endpoint="http://otel-collector:4317", insecure=True))
provider.add_span_processor(processor)
trace.set_tracer_provider(provider)app = FastAPI()from opentelemetry.instrumentation.fastapi import FastAPIInstrumentor
from opentelemetry.instrumentation.requests import RequestsInstrumentorFastAPIInstrumentor.instrument_app(app)
RequestsInstrumentor().instrument()@app.get("/process")
def process():
node_response = requests.get("http://node-service:5000/finalize").json()
return {
"layer": "Python Microservice",
"downstream": node_response
}if __name__ == "__main__":
uvicorn.run(app, host="0.0.0.0", port=8000)node-service/Dockerfile
FROM node:18-alpine
WORKDIR /app
COPY package.json ./
RUN npm install
COPY . .
EXPOSE 5000
CMD ["npm", "start"]
node-service/package.json
{
  "name": "node-service",
  "version": "1.0.0",
  "main": "server.js",
  "dependencies": {
    "@opentelemetry/api": "^1.9.0",
    "@opentelemetry/sdk-node": "^0.57.0",
    "@opentelemetry/exporter-trace-otlp-grpc": "^0.57.0",
    "@opentelemetry/auto-instrumentations-node": "^0.56.0",
    "express": "^4.19.2"
  },
  "scripts": {
    "start": "node -r ./tracing.js server.js"
  }
}
node-service/server.js
const express = require('express');
const app = express();
const PORT = 5000;
app.get('/finalize', (req, res) => {
res.json({
layer: "Node.js Database Core",
status: "Pipeline successfully finished executing!"
});
});app.listen(PORT, () => {
console.log(`Node engine running on port ${PORT}`);
});node-service/tracing.js
const opentelemetry = require("@opentelemetry/sdk-node");
const { getNodeAutoInstrumentations } = require("@opentelemetry/auto-instrumentations-node");
const { OTLPTraceExporter } = require("@opentelemetry/exporter-trace-otlp-grpc");
const sdk = new opentelemetry.NodeSDK({
resource: new (require("@opentelemetry/resources").Resource)({
"service.name": "node-service",
}),
traceExporter: new OTLPTraceExporter({
url: "http://otel-collector:4317",
}),
instrumentations: [getNodeAutoInstrumentations()],
});sdk.start();🚀 Running the Application
⚠️ This guide assumes you are running on a Mac with Apple Silicon (M1/M2/M3).
Step 1: Clone the Repository
git clone https://github.com/suneelkandali/multilayerapp-distributedtracing-playground
cd multilayerapp-distributedtracing-playground
Step 2: Ensure Docker Desktop is Running
Open Docker Desktop from your Applications folder. Wait for the Docker engine to start (the Docker icon in the menu bar should turn green).
docker infoStep 3: Free Up Required Ports
Before starting the application, ensure the following ports are not in use by other processes. These ports are required by the demo services:
PortService3001React Frontend8080Spring Boot API8000Python FastAPI5002Node.js Express16686Jaeger UI4317OTel Collector gRPC4318OTel Collector HTTP
Check all required ports at once:
for port in 3001 8080 8000 5002 16686 4317 4318; do
  pid=$(lsof -ti :$port 2>/dev/null)
  if [ -n "$pid" ]; then
    echo "⚠️  Port $port is in use by PID $pid"
  else
    echo "✅ Port $port is available"
  fi
done
Free up a specific port (if occupied):
# Find the process using the port
lsof -i :3001
# Kill the process (replace PID with the actual process ID from the output above)
kill -9 <PID>Free up all required ports at once:
for port in 3001 8080 8000 5002 16686 4317 4318; do
  pid=$(lsof -ti :$port 2>/dev/null)
  if [ -n "$pid" ]; then
    echo "Killing process on port $port (PID: $pid)"
    kill -9 $pid
  fi
done
Step 4: Build and Start All Services
From the project root directory, run:
docker compose up --buildThis command will:
- Pull the Jaeger and OpenTelemetry Collector images from Docker Hub.
- Build Docker images for all four application services (React, Spring Boot, Python, Node.js).
- Start all 6 containers and connect them via a shared Docker bridge network (
otel-network).
Step 5: Wait for Services to Start
On first run, the Spring Boot Maven build may take 2–5 minutes to download dependencies. Watch the terminal output for these readiness messages:
spring-boot-api    | Started DemoApplication in X seconds
python-service     | Uvicorn running on http://0.0.0.0:8000
node-service       | Node engine running on port 5000
react-frontend     | Compiled successfully!
Step 6: Access the Application
Open the following URLs in your Mac browser:
ServiceURL. Purpose
React Frontend http://localhost:3001 UI to trigger the cascade
Jaeger UI http://localhost:16686 View distributed traces
Spring Boot http://localhost:8080/api/start Direct API endpoint
Python Service http://localhost:8000/process Direct API endpoint
🧪 Testing the Application
Test 1: Trigger a Full Distributed Trace via the UI
- Open **http://localhost:3001** in your browser.
- Click the “Fire Microservice Cascade 🚀” button.
- Wait for the response — you should see a green success box with a JSON response:
{ "layer": "Spring Boot API Gateway", "downstream": { "layer": "Python Microservice", "downstream": { "layer": "Node.js Database Core", "status": "Pipeline successfully finished executing!" } } }

Test 2: View the Distributed Trace in Jaeger
- Open **http://localhost:16686** in your browser.
- In the left sidebar, select Service →
react-frontend(or any of the four services). - Click “Find Traces”.
- Click on the most recent trace to view the full waterfall:
- You should see 4 spans in a waterfall pattern:
react-frontend(HTTP fetch)spring-boot-api(HTTP GET /api/start)python-service(HTTP GET /process)node-service(HTTP GET /finalize)- All spans should share the same Trace ID, confirming successful context propagation.

Test 3: Verify Individual Service Endpoints
Test each service independently using curl:
# React Frontend (requires browser)
open http://localhost:3001
# Spring Boot API Gateway
curl http://localhost:8080/api/start# Python FastAPI Service
curl http://localhost:8000/process# Node.js Express Service
curl http://localhost:5002/finalize🔍 Debugging Potential Issues
Issue 1: Port Already in Use
Symptom: Bind for 0.0.0.0:XXXX failed: port is already allocated
Solution:
# Find the process using the port
lsof -i :XXXX
# Kill the process (replace PID with the actual process ID)
kill -9 <PID># Or stop all Docker containers and retry
docker compose down
docker compose up --buildIssue 2: Spring Boot Container Fails to Start
Symptom: spring-boot-api exits immediately or keeps restarting.
Solution:
# Check the Spring Boot logs
docker compose logs spring-boot-api
# Common cause: Maven dependency download failed. Rebuild:
docker compose down
docker compose up --build spring-boot-apiIssue 3: React Frontend Cannot Reach Spring Boot
Symptom: “Cascade Blocked” error in the UI, or fetch failed in the browser console.
Solution:
- Ensure Spring Boot is fully started before clicking the button (watch the logs).
- The React frontend uses
http://localhost:8080to call Spring Boot. Verify Spring Boot is running: curl [http://localhost:8080/api/start](http://localhost:8080/api/start)
Issue 4: No Traces Appearing in Jaeger
Symptom: Jaeger UI shows no traces after triggering the cascade.
Solution:
- Verify the OTel Collector is running:
docker compose ps otel-collector
- Check the collector logs:
docker compose logs otel-collector
- Ensure the
react-frontendtracing.js exporter URL points tohttp://localhost:4318(the HTTP port exposed to the Mac host).
Issue 5: Docker Build Fails on Apple Silicon
Symptom: exec format error or image architecture mismatch errors.
Solution:
- Ensure you are using the latest version of Docker Desktop for Mac, which natively supports ARM64.
- Try clearing Docker build cache:
docker compose down docker builder prune -a docker compose up --build
Issue 6: Python Service Import Errors
Symptom: ModuleNotFoundError in Python service logs.
Solution:
# Rebuild the Python service image from scratch
docker compose build --no-cache python-service
docker compose up python-service
Viewing Logs for Any Service
# Real-time logs for a specific service
docker compose logs -f <service-name>
# Examples:
docker compose logs -f react-frontend
docker compose logs -f spring-boot-api
docker compose logs -f python-service
docker compose logs -f node-service
docker compose logs -f otel-collector
docker compose logs -f jaeger🧹 Clean Up Resources
Stop All Services (Keep Containers)
docker compose stopStop and Remove All Containers and Networks
docker compose downFull Cleanup (Remove Containers, Networks, and Build Images)
docker compose down --rmi allRemove All Docker Build Cache
docker builder prune -aVerify Cleanup
docker compose ps
docker images | grep -E "opentelemetry|react|spring|python|node"
📌 Note
These steps are specifically written for running the application on a Mac with Apple Silicon (M1, M2, or M3) chip using Docker Desktop for Mac. The Docker images used in this project (
node:18-alpine,python:3.11-slim,eclipse-temurin:17,maven:3.9-eclipse-temurin-17) all have multi-architecture builds that supportlinux/arm64, so no special platform flags are needed on Apple Silicon. If you are running on an Intel-based Mac or a Linux x86_64 machine, the same instructions apply — Docker will automatically pull the correct architecture images.
메타데이터
- post_id
- c7b572e000a4
- slug
- opentelemetry-playground-distributed-tracing-demo-c7b572e000a4
- url
- https://medium.com/@suneelr.kandali/opentelemetry-playground-distributed-tracing-demo-c7b572e000a4
- canonical_url
- https://medium.com/@suneelr.kandali/opentelemetry-playground-distributed-tracing-demo-c7b572e000a4
- author_url
- https://medium.com/@suneelr.kandali
- status
- ok
- fetched_at
- 2026-07-10 11:40:45