Stop Guessing. Start Debugging. Introducing the Dot Liquid Template Debugger for VS Code.
The first professional-grade, line-by-line Liquid template debugger — with AI generation, multi-format support, and zero telemetry.
Stop Guessing. Start Debugging. Introducing the Dot Liquid Template Debugger for VS Code.
The first professional-grade, line-by-line Liquid template debugger — with AI generation, multi-format support, and zero telemetry.
If you have spent more than a few hours working with Liquid templates — especially inside Azure Logic Apps, Shopify, or any data integration pipeline — you know the feeling.
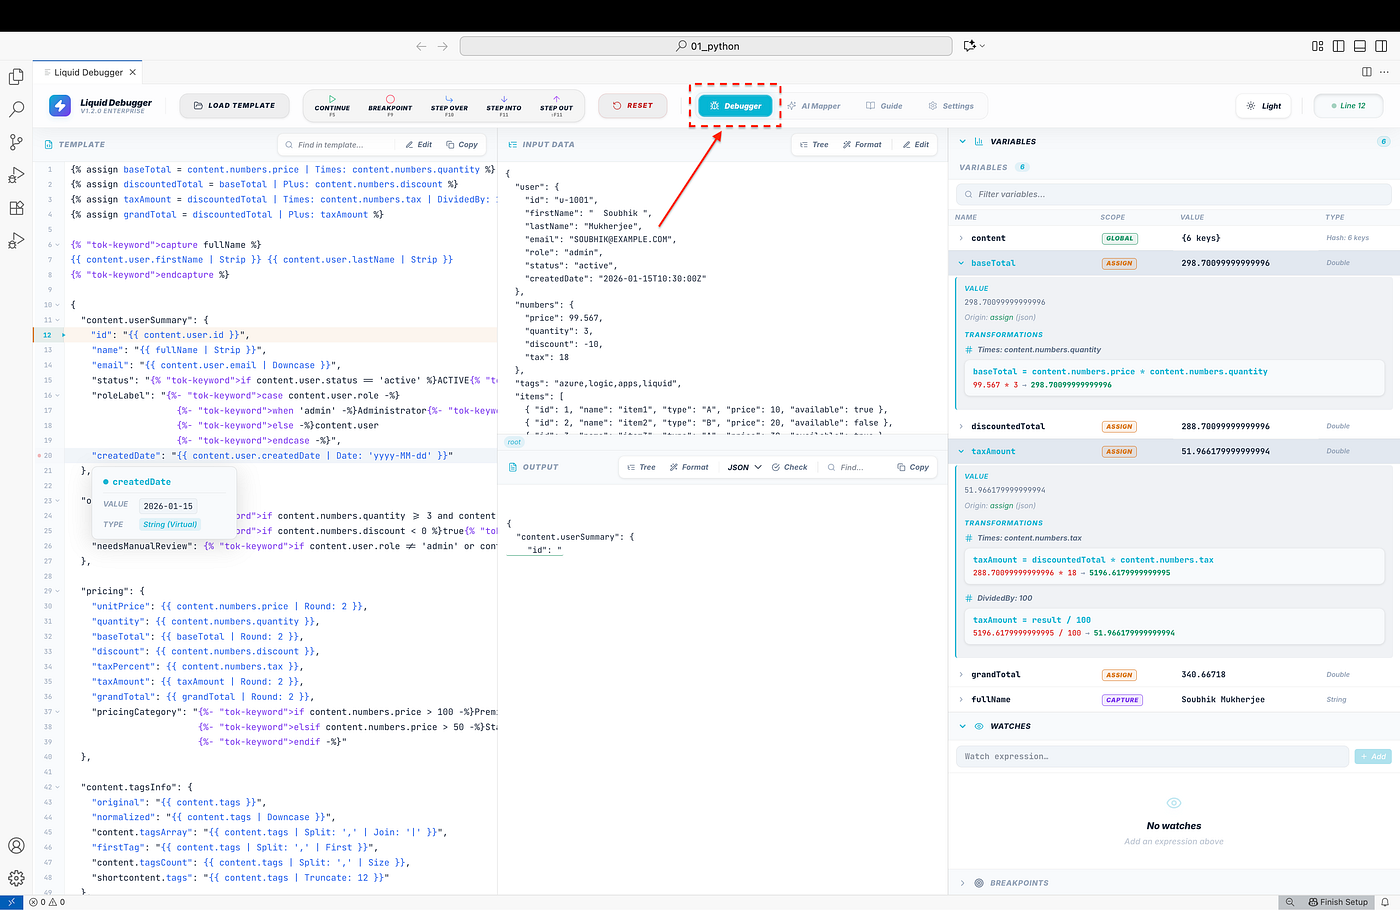
You run the template. The output is wrong. You stare at it. You add a console log that does not exist. You tweak a variable, run again, still wrong. You comment out half the template to binary-search the problem. Forty minutes later, you find a missing content. prefix on line 12.
There has never been a proper debugger for this. Until now.
Introducing Dot Liquid Template Debugger
**Dot Liquid Template Debugger** is a VS Code extension that brings genuine, IDE-quality debugging to Liquid templates. You step through execution line by line, watch variables change value in real time, set conditional breakpoints, and see exactly where every value came from.
It ships with:
- 🔍 Line-by-line step execution with full variable inspection
- 🎯 Breakpoints — including conditional breakpoints with Liquid expressions
- 👁️ Watch expressions — monitor any value across every step
- 🔄 Multi-format data — load input as JSON, XML, CSV, or key=value text
- 🤖 AI template generation — describe what you need, get production-ready Liquid instantly
- 📖 Built-in Liquid reference — searchable guide for all tags, filters, and operators
- 🎨 Multiple visual themes — pick the look that fits your workspace
- 🔒 Zero telemetry — your templates and data never leave your machine
Version 2.0.5 · Published by Soubhik Dev Tools · Install free from the VS Code Marketplace
The Problem With Debugging Liquid Templates
Liquid is deceptively simple on the surface. But production templates — especially in Azure Logic Apps — grow complex fast.
{% assign tax = content.order.subtotal | times: content.rates.tax | divided_by: 100 %}
{% for item in content.order.items %}
  {% if item.active and item.qty > 0 %}
    {{ item.name | upcase }}: {{ item.price | times: item.qty | round: 2 }}
  {% endif %}
{% endfor %}
When this produces the wrong output, you have no idea whether:
content.rates.taxisnullor the wrong type- the
forloop is iterating over the right collection item.activeis a boolean or the string"true"- the filter chain is applying in the order you think it is
Traditional debugging approaches — adding {{ myVar }} output statements everywhere, splitting the template into chunks, console logging the rendered output — are slow, imprecise, and destructive to the template structure.
What you actually need is a debugger. The same thing every other language has had for 30 years.
How It Works
1. Launch in One Click
Open any .liquid file and click the Liquid Debugger icon in the Activity Bar. Or right-click the file → Liquid: Start Debugging. Or use the Command Palette:
PlatformShortcutmacOSCmd+Shift+P → Liquid: Start DebuggingWindows / LinuxCtrl+Shift+P → Liquid: Start Debugging

2. Load Your Template and Data
A popup lets you paste your template directly or load it from the active .liquid file. Paste your sample data payload in JSON, XML, CSV, or plain text format. Or pick one of the built-in sample datasets to explore immediately.


All data stays on your machine. Nothing is sent anywhere.
3. Step Through Execution
Click Start Debugging and the engine pauses at the first line of your template. From there you have full control:

The main debug window shows you everything at once:
- Template panel (left) — the template source with the current line highlighted
- Variables panel (centre) — every variable in scope, with current value and type
- Output panel (right) — the rendered output building up line by line
You can step Next, Into, Over, or Out — the same controls you use in any debugger. Every step re-evaluates all watches and updates the variable panel instantly.
4. Breakpoints That Actually Work
Click next to any line number to set a breakpoint. Add an optional condition expression — pure Liquid syntax — so the debugger only stops when that condition is true.
forloop.index == 3
item.price > 100
content.order.status == "pending"
This is critical for debugging loops. Instead of stepping through 500 items one by one, you set forloop.index == 499 and run straight to the iteration that breaks.
5. Full Variable Transformation History
The Variables panel tracks not just the current value of every variable, but the full history of how it changed. Click any variable to expand its transformation chain — you see exactly which filter changed it and what the value was at each step.


Add any expression to the Watch panel — content.order.total | times: 1.18 | round: 2, for example — and see it re-evaluated on every single step.
AI-Powered Template Generation
Debugging is half the story. The other half is writing the template in the first place.
For complex field-mapping work — transforming a JSON payload from one system into the XML or CSV format expected by another — you can describe the transformation in plain English and let the AI generate the Liquid for you.
Configure Once
Open the Settings panel, paste your Gemini API key, and validate it. The key is stored in VS Code’s native SecretStorage (the same encrypted store used for your Git credentials). It is never written to any settings file.

Select your model. The default is Gemini 2.0 Flash — fast, accurate, and optimised for structured data transformations. The full list of available models is fetched live from the API.

Generate in Seconds
Click the Generate Template button and describe your transformation. You can provide:
- Input data — your actual sample payload (JSON, XML, CSV, or text)
- Expected output — the structure you want to produce
- Requirements — plain-English rules (“if discount is zero, omit the Discount element”)
- Field mapping table — paste directly from Excel or Google Sheets

The generated template loads directly into the debugger. Step through it immediately to verify it handles your edge cases.

Multi-turn continuation means the AI never truncates. If the template is too long for a single response, it continues automatically across multiple rounds and stitches the result together — you see the complete template, not a cut-off fragment.
Built-in Liquid Reference
The Guide panel is a fully searchable, in-IDE Liquid reference. Every tag, filter, and operator is documented with live examples. No more switching to a browser tab mid-debugging.

Visual Themes
The Theme Selector in Settings lets you switch between multiple visual presets. Whether you prefer light, dark, or high-contrast, there is a layout that keeps the information readable across long debugging sessions.

Built for Enterprise: Multi-Format Data Support
In the real world, data is never just JSON. Enterprise integrations deal with XML payloads from SAP, CSV exports from legacy ERPs, and key=value text from custom systems. The debugger handles all four formats — as both input and output — with a full transformation matrix:

Load your input in any format, write a Liquid template to reshape it, validate the output in the target format. The Validate button checks that the rendered output is syntactically valid JSON, well-formed XML, or RFC-4180 compliant CSV.
Security Architecture
Security was designed in from the start — not bolted on.
Your data never leaves your machine. All template rendering and step-through logic runs entirely inside the VS Code extension host. There is no backend server, no cloud API, no telemetry pipeline. Your templates and payloads are private by design.
The webview runs under a strict Content Security Policy with nonce-protected scripts and no inline execution. localResourceRoots is locked to the extension's own dist/ directory.
AI features are strictly opt-in. The extension is fully functional without an internet connection and without an API key. When you do configure Gemini, your key lives only in VS Code’s encrypted SecretStorage.
Automatic PII scrubbing runs on all data before it reaches the AI model. Emails, credit card numbers, and any custom patterns you define are redacted before the prompt is transmitted.
For security researchers: the extension uses Object.create(null) context objects throughout to prevent prototype pollution, crypto.randomInt() for all ID generation, and ReDoS protection on every user-supplied regex pattern.
Template Management
The Template Menu gives you quick access to switch between template versions and sample datasets during a debugging session.

Every command is also available through the VS Code Command Palette — no mouse required.

Get Started in Under 30 Seconds
- Open VS Code
- Go to Extensions (
Cmd+Shift+X/Ctrl+Shift+X) - Search “Dot Liquid Template Debugger”
- Click Install
- Open any
.liquidfile → click the Liquid icon in the Activity Bar - Paste your template and data → click Start Debugging
Or install directly from the terminal:
code --install-extension SoubhikDevTools.dot-liquid-template-debugger→ **Install from the VS Code Marketplace**
What’s Coming Next
The roadmap includes:
- Reverse debugger — step backwards through execution history
- Diff view — compare template output across different data payloads side by side
- Team sharing — export and share debug sessions
- More AI models — Claude, GPT-4o, and local model support
Closing Thoughts
Liquid templates are used everywhere — e-commerce, CMS platforms, enterprise integration pipelines, email systems. Despite that reach, debugging them has always meant editing in the dark.
We built this extension because we needed it ourselves. Every feature exists because a real debugging session hit a real wall that needed a real solution.
If you work with Liquid templates, install it, try it, and let us know what you think. Issues and feature requests are open on GitHub.
Built with ❤️ for the Liquid community by Soubhik and Bob.
메타데이터
- post_id
- cb4baf2e32f8
- slug
- stop-guessing-start-debugging-introducing-the-dot-liquid-template-debugger-for-vs-code-cb4baf2e32f8
- url
- https://medium.com/@sou7bhik/stop-guessing-start-debugging-introducing-the-dot-liquid-template-debugger-for-vs-code-cb4baf2e32f8
- canonical_url
- https://medium.com/@sou7bhik/stop-guessing-start-debugging-introducing-the-dot-liquid-template-debugger-for-vs-code-cb4baf2e32f8
- author_url
- https://medium.com/@sou7bhik
- status
- ok
- fetched_at
- 2026-06-09 15:37:30




