From Metrics to Profiling: Redefining Data Center Monitoring with Grafana Phlare
How Grafana Phlare is pushing observability beyond metrics and logs into continuous profiling for modern infrastructure.
Unlock real-time performance intelligence in your data center with profiling-first observability.
From Metrics to Profiling: Redefining Data Center Monitoring with Grafana Phlare
How Grafana Phlare is pushing observability beyond metrics and logs into continuous profiling for modern infrastructure.

Traditional data center monitoring revolves around two pillars: metrics and logs. These are foundational for alerting, performance tracking, and root cause analysis. However, as workloads become increasingly distributed, containerized, and resource-intensive, these tools often fall short in providing fine-grained insights into application behavior — especially when milliseconds matter.
Enter Grafana Phlare, a powerful new addition to the Grafana stack that brings continuous profiling to the forefront. In this blog, we’ll explore how Phlare works, how it complements tools like Prometheus and Loki, and why profiling is emerging as the third pillar of observability for modern data centers.
The Observability Evolution: Metrics, Logs, and Now Profiling
Metrics
These are numeric time-series data points — ideal for measuring CPU usage, memory pressure, I/O rates, etc.
Logs
Logs offer structured/unstructured event-level insights. They’re useful for debugging application-level failures and tracing user actions.
Profiling (Phlare’s Contribution)
Profiling goes deeper — it answers where the CPU cycles are spent, how memory allocations behave over time, and what functions are consuming the most resources.
In a microservices-heavy, Kubernetes-powered setup, profiling provides clarity that neither metrics nor logs can offer alone.
What Is Grafana Phlare?
Grafana Phlare is a continuous profiling platform purpose-built for cloud-native environments. It collects high-resolution performance data from your applications and infrastructure and stores it in a time-series database.
Key Features:
- PProf-compatible ingestion
- Integrated with Grafana UI
- Supports Kubernetes and microservices environments
- Scale-aware storage model

Why Continuous Profiling Matters
In high-scale environments:
- A spike in CPU usage might not tell you which function or thread is responsible.
- Metrics might alert you to a slowdown, but not why it’s happening.
- Logs might show errors, but profiling shows performance bottlenecks before they become errors.
Phlare answers:
- Which line of code is using the most CPU?
- Are there memory leaks increasing over time?
- Is garbage collection throttling your app?
With continuous profiling, you can:
- Optimize workloads with real-time visibility
- Detect performance regressions in CI/CD
- Reduce cloud costs by understanding code behavior
Architecture: How Phlare Works
Grafana Phlare consists of:
- Ingestors: Collect profiling data (e.g., via
pprof, eBPF). - Storage Layer: Time-series database designed for profiles.
- Query Engine: Supports flamegraphs, diff views, and time travel.
- UI Integration: Visualizations integrated into Grafana dashboards.
It is language-agnostic, working with Go, Python, Node.js, and more — especially when paired with tools like Pyroscope or Parca.
Integration with Kubernetes and Observability Stack
Grafana Phlare integrates seamlessly into your Kubernetes-native observability toolkit.
You can use it alongside:
- Prometheus: For metrics
- Loki: For logs
- Tempo: For traces
- Phlare: For profiling
Example Kubernetes deployment:
apiVersion: apps/v1kind: Deploymentmetadata:name: phlarespec:containers: - name: phlare image: grafana/phlare:latest ports: - containerPort: 4100Real-World Use Cases
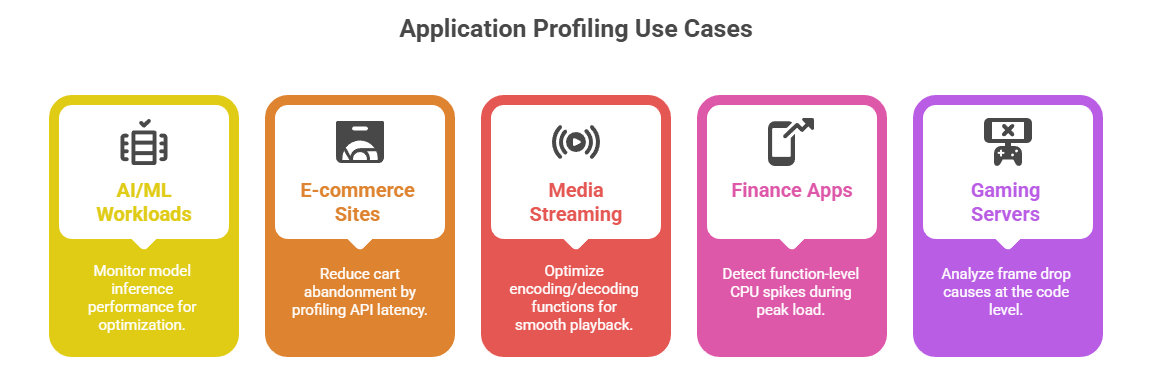
- AI/ML Workloads: Monitor model inference performance
- E-commerce Sites: Reduce cart abandonment by profiling API latency
- Media Streaming: Optimize encoding/decoding functions
- Finance Apps: Detect function-level CPU spikes during peak load
- Gaming Servers: Analyze frame drop causes at the code level
Tips for Getting Started with Grafana Phlare
- Install with Docker or Kubernetes Helm charts
- Profile with tools like Pyroscope or native Go pprof
- Use Grafana dashboards for visualization
- Correlate with logs and traces for full context
Sample flamegraph:
main() -> handler() -> parseJson() -> compute() |________> fetchUserData() -> SQLquery() This helps you visualize performance bottlenecks over time.
Conclusion
Grafana Phlare brings a transformative approach to data center monitoring by adding real-time, continuous profiling to your observability stack. In an age where performance, latency, and cost-efficiency are business-critical, traditional metrics and logs just aren’t enough.
Whether you’re running large-scale Kubernetes clusters or microservices for AI workloads, Phlare offers the deep insights needed to fine-tune performance and proactively prevent issues.
As cloud infrastructure becomes more dynamic and demanding, tools like Phlare aren’t just useful — they’re essential.
If you’re looking to scale your virtual environments with GPU acceleration, check out **StackGPU — a leading platform offering GPU-powered virtual machines ideal for AI training, 3D rendering, scientific simulations, and virtual desktop infrastructure (VDI)**.
메타데이터
- post_id
- f1c68df86f96
- slug
- from-metrics-to-profiling-redefining-data-center-monitoring-with-grafana-phlare-f1c68df86f96
- url
- https://medium.com/@StackGpu/from-metrics-to-profiling-redefining-data-center-monitoring-with-grafana-phlare-f1c68df86f96
- canonical_url
- https://medium.com/@StackGpu/from-metrics-to-profiling-redefining-data-center-monitoring-with-grafana-phlare-f1c68df86f96
- author_url
- https://medium.com/@StackGpu
- status
- ok
- fetched_at
- 2026-07-18 13:07:25