How I Found a Deadlock Inside ART That ART Itself Couldn’t Dump
A whole-VM lock-ordering deadlock between the garbage collector and the JDWP debug layer, reproduced on two independent targets, bisected…
How I Found a Deadlock Inside ART That ART Itself Couldn’t Dump
A whole-VM lock-ordering deadlock between the garbage collector and the JDWP debug layer, reproduced on two independent targets, bisected to a specific ART mainline update — filed as Issue #530992434 on the Android Public Tracker.
TL;DR
On Android 16, attaching a Java debugger (JDWP) to a large debuggable app reliably freezes the whole process and triggers an ANR. The same app runs fine without a debugger, and small apps attach with no problem.
The cause is a userspace lock-ordering deadlock between the garbage-collector thread and the native debug layer (libjdwp / libopenjdkjvmti) inside ART. At that point a Java stack dump is impossible — the VM is "blind." The only way to see what's going on is a native thread dump (ptrace) plus per-thread kernel wait states (waiting channels).
Since first publishing this writeup, the bug has been:
- Reproduced on two independent targets: the original Samsung Galaxy S22 hardware, and a stock Google Play arm64 emulator image with zero OEM customization — ruling out a vendor-specific explanation.
- Bisected to a specific ART mainline regression window: it does not reproduce on ART mainline versionCode
361143214and earlier, but reproduces reliably from versionCode371000140onward, with the OS version held constant — pointing at a specific mainline update rather than an OS-level change. - Filed with a public, minimal, MIT-licensed reproducer: github.com/Vitaliy69/art-jdwp-deadlock-repro.
Symptom
- Device: Samsung Galaxy S22, Android 16 (API 36), ART mainline
v371000140. - Behavior: “Run” works perfectly. “Debug” / “Attach debugger to process” → a few seconds later a white screen → ANR → the OS kills the process.
- Isolation: on the same laptop and phone, a small app attaches instantly.
This is the classic signature of a runtime bug, not app code: the program logic doesn’t change, the failure is triggered purely by the debugger’s presence.
Why the usual tools are useless
The first thing you do on a hang is grab a Java stack (kill -3 or an ANR trace). Here it simply won't come:
tombstoned: intercept for pid ... kDebuggerdJavaBacktrace terminated: due to timeoutA SIGQUIT dump goes through a safepoint: the runtime must bring every thread to a stop point to take a consistent snapshot of the heap. But if the GC thread is stuck in the middle of processing system weak references, the safepoint is unreachable. The VM is in an inconsistent state and the standard Java dump times out.
The system log confirms the problem is locked inside the VM itself:
Mutator lock exclusive owner tid: -1
Waiting for a blocking GC ProfileSaver
In one run, ART aborted outright:
SuspendThreadByPeer timed out: <io-pool-thread>: ... Final wait time: 16.017sThe runtime could not suspend a thread for the JDWP/GC operation — which is a strong hint that the deadlock isn’t a timing fluke, but a structural ordering problem.
Getting data when the VM is blind
You need tools that don’t require a safepoint — they read the process from the outside, through the kernel:
1. Native unwind of all threads (ptrace). An adb bugreport captured while the app is hung contains a VM TRACES JUST NOW section — a forced native unwind of every thread (the equivalent of debuggerd -b <pid>). The log shows the fallback:
Java unwind failed for pid ..., trying a native unwind.2. Waiting channels — per-thread kernel wait state. Which syscall each thread is parked on. This tells you at a glance whether there’s a runaway thread burning CPU or a pure deadlock:
sysTid=NNNNN  futex_wait_queue_me
sysTid=NNNNN  binder_wait_for_work
sysTid=NNNNN  do_epoll_wait
Every thread is in a normal, passive wait (futex / binder / epoll). Nobody is spinning the CPU, nobody is stuck in an abnormal syscall. This confirms a classic userspace lock deadlock.
Capturing the dump, step by step
[embed]
Read the Waiting Channels first: if every thread sits in futex_wait_queue_me / binder_wait_for_work / do_epoll_wait and none is spinning, you're looking at a pure lock deadlock — then use the native unwind to name the lock.
Sanitize before sharing: strip the package name, hosts and user IDs, and delete the
memory map,open files, andmemory nearsections — raw memory can leak private data. A fulladb bugreportalso carries your signed-in account, device serial, IMEI, and Wi-Fi history — never publish it as-is; extract only the relevant thread-dump section.
Reading the dump: anatomy of the deadly loop
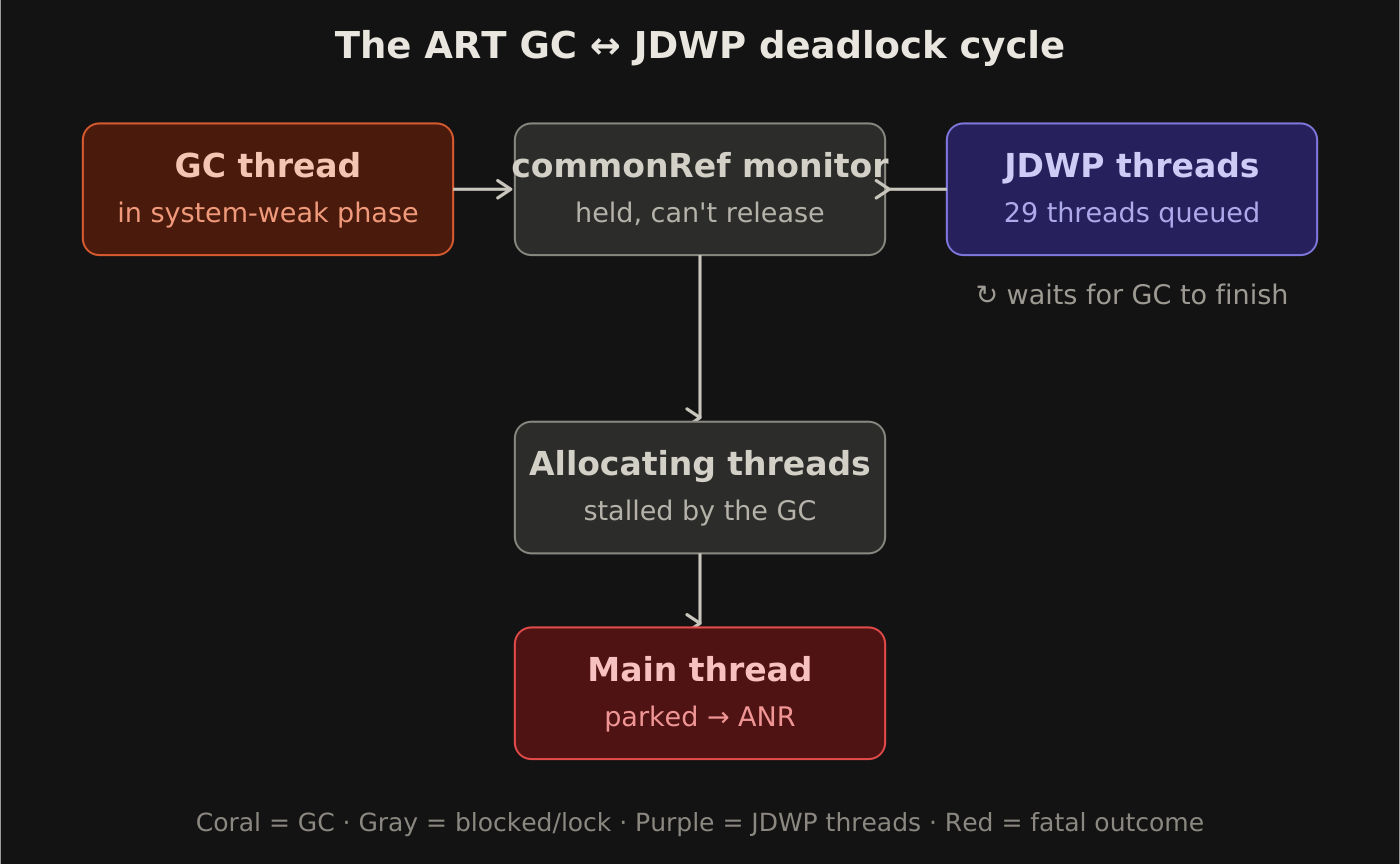
The native unwind plus wchan reveal a circular wait between the GC daemon and the JDWP event infrastructure.
1. The GC thread is blocked
HeapTaskDaemon is in the system-weak processing phase, in the middle of a collection cycle. It's trying to deliver "object freed" events for objects the debugger has tagged — and to do that it must enter the JDWP common-reference monitor (commonRef). The native unwind shows it dead-stopped on the userspace std::mutex::lock():
art::Runtime::AllowNewSystemWeaks()
 -> openjdkjvmti::ObjectTagTable::Allow()
 -> openjdkjvmti::ObjectTagTable::SendSingleFreeEvent(long)
 -> libjdwp: commonRef_handleFreedObject()
 -> libjdwp: debugMonitorEnterNoSuspend()
 -> std::mutex::lock()   [__futex_wait_ex]     <- BLOCKED
2. The JDWP threads jammed the gate
At the same moment the runtime is flooded with JDWP debug events. The commonRef monitor is held by another JDWP thread that cannot finish and release the lock, because it's waiting for the GC cycle to complete. Meanwhile 29 threads are queued on that same monitor inside debugMonitorEnter:
- 18 threads on
libjdwp: debugMonitorEnter -> event_callback -> cbThreadEnd - 9 threads on
libjdwp: debugMonitorEnter -> event_callback -> cbClassPrepare - a few more on other events
3. Allocation and the main thread grind to a halt
Any thread that needs to allocate right now blocks, waiting for a GC that will never finish:
art::gc::Heap::WaitForGcToComplete() -> WaitForGcToCompleteLocked() <- BLOCKEDThe main thread is parked in Unsafe.park (LockSupport.park): it's waiting on a startup latch that no one can signal, because all the worker threads are wedged in the states above.
The circular wait
+-------------------------------------------+
                          |                                           |
                          v                                           |
             +-----------------------------+                          |
             |  HeapTaskDaemon (GC)         |                          |
             |  MarkCompact::RunPhases()    |                          |
             |  mid system-weak processing  |                          |
             |  AllowNewSystemWeaks         |                          |
             |   -> ObjectTagTable::Allow   |                          |
             |   -> SendSingleFreeEvent     |                          |
             |   -> commonRef_handleFreedObj|                          |
             +--------------+--------------+                           |
                            | blocks on                               | cannot release
                            v                                         | until GC finishes
             +-----------------------------+   held by   +------------+-----------+
             |  JDWP `commonRef` monitor    | ----------> |  JDWP event thread     |
             +--------------^--------------+              |  (draining callbacks)  |
                            |                             +------------------------+
                            | 29 threads queued in debugMonitorEnter
                            |   - 18 x cbThreadEnd
                            |   -  9 x cbClassPrepare
                            |   -  a few others
                            |
   -- side effects ---------+------------------------------------------------------
   allocating threads -> Heap::WaitForGcToComplete()      -> blocked (GC never finishes)
   main thread        -> Unsafe.park() on a startup latch -> never signaled -> ANR
A pure userspace lock-ordering deadlock. And the Java stack can’t be dumped precisely because the GC is frozen mid system-weak processing, denying the VM a consistent safepoint.
Why it only reproduces on large apps
The window for this deadlock is narrow, but a large app creates the perfect conditions to hit it reliably:
- Tens of thousands of classes → a storm of
CLASS_PREPAREevents the instant the debugger attaches. - Hundreds of concurrent threads → a dense stream of
THREAD_ENDevents. - Heavy allocation at startup → the GC daemon fires right in the middle of that event storm.
The runtime is then guaranteed to hit the lock-ordering window between ObjectTagTable/commonRef and system-weak processing. A small app never puts that much pressure on the debug layer and the heap — so it attaches instantly.
Reproduction conditions
- A large debuggable app: very high class count, hundreds of threads, heavy allocation during startup.
- Launch it under the debugger, or a normal “Run” followed by a manual Attach to the live process.
- Within a few seconds — a whole-VM deadlock, a frozen process, and a system ANR.
Building a minimal repro
You don’t need a real 10-million-line app — you need the three pressure signals at once, during the attach window: a **CLASS_PREPARE storm, a `THREAD_END` storm, and GC pressure**. A synthetic debuggable app is enough. The full working reproducer is public: github.com/Vitaliy69/art-jdwp-deadlock-repro. The core idea:
1. Generate tens of thousands of trivial classes (Gradle code-gen), so attaching floods the debugger with CLASS_PREPARE:
[embed]
2. Trigger all three storms in Application.onCreate():
[embed]
<!-- AndroidManifest.xml -->
<application android:name=".ReproApp" android:debuggable="true" ... />
3. Reproduce: launch under the debugger (or Run + Attach), on Android 16 / ART v371000140. Within a few seconds the process wedges and ANRs; the native dump shows the same AllowNewSystemWeaks → commonRef_handleFreedObject → debugMonitorEnter cycle.
Numbers are illustrative — the exact class/thread/allocation counts that hit the window vary by device and heap size. The point is to overlap the three signals in the attach window; scale them up until it reproduces.
It’s not device-specific — and it’s a recent regression
The obvious first question from anyone triaging this is: is this a Samsung problem? So the reproducer was run again on a completely different, unmodified target: a Google Play arm64 emulator image (sdk_gphone16k_arm64), no OEM layer at all. Same deadlock, same exact HeapTaskDaemon → commonRef_handleFreedObject → debugMonitorEnterNoSuspend cycle, same JDWP event-thread pileup. That rules out vendor firmware as a factor — the defect lives entirely in the upstream ART/libjdwp/libopenjdkjvmti mainline code.
The second question is how long has this been broken? Testing several ART mainline versions on the same Android OS version narrowed it down:

Holding the OS version constant across the negative results rules out an OS-level suspend-model change as the cause — the regression was introduced somewhere in the ART mainline train between versionCode 361143214 and 371000140. Consistent with this: the Samsung Galaxy S22 received the 371000140 mainline update on July 3, 2026 — one day before the deadlock was first observed. This looks like a recent regression, not a long-standing latent bug.
Note on the Android 17 target:
ro.build.version.codenameon that emulator image readsREL, i.e. this was a finalized release build, not a Developer Preview/Alpha image — so the regression is confirmed to persist into the next OS branch's actual release, not just an early preview snapshot.
Framing against ART’s own design docs: this is a genuine invariant violation
It’s worth being precise about what kind of bug this is, because ART’s own documentation describes two failure modes that look superficially similar but aren’t this one — and it’s worth ruling them out explicitly. Two docs describe the model this defect breaks:
[runtime/thread_suspension_timeouts.md](https://android.googlesource.com/platform/art/+/refs/heads/main/runtime/thread_suspension_timeouts.md)[runtime/mutator_gc_coord.md](https://android.googlesource.com/platform/art/+/c046db79d0/runtime/mutator_gc_coord.md)
Per mutator_gc_coord.md, GC-internal work — including system-weak processing — is expected to run to completion: when a mutator isn't runnable, the collector performs the required action on its behalf, and only afterward is the mutator allowed back to runnable. The entire coordination model assumes the collector's weak-reference phase will complete.
This defect inverts that assumption. During a concurrent mark-compact GC, the collector blocks on an agent-owned native monitor from inside its own system-weak re-enable step:
art::gc::collector::MarkCompact::RunPhases()
 -> art::Runtime::AllowNewSystemWeaks()
 -> openjdkjvmti::ObjectTagTable::Allow()
 -> openjdkjvmti::ObjectTagTable::SendSingleFreeEvent(long)
 -> libjdwp: commonRef_handleFreedObject()
 -> libjdwp: debugMonitorEnterNoSuspend()
 -> std::mutex::lock()  [__futex_wait_ex]   <-- BLOCKED
The libjdwp commonRef monitor is held by a JDWP thread that can't release it until the GC completes, while dozens of JDWP event-callback threads (cbThreadEnd / cbClassPrepare) queue up behind it. So the collector ends up waiting on a lock whose release is gated on the collector itself finishing — a textbook ABBA lock-ordering inversion. Because it happens inside the system-weak window, the GC never completes, mutators can never transition back to runnable, and no safepoint is ever reachable — which is exactly why SIGQUIT Java dumps time out and only native ptrace unwinds succeed.
This maps directly onto cause #1 in thread_suspension_timeouts.md — "native C++ locks that are ... held while executing Java code" — which the doc itself classifies as a clear bug with a reasonably clear-cut fix. Here, the offending native lock (commonRef) is acquired from inside ART/libjdwp itself, not from application code.
It is explicitly not causes #2–#4 in the same doc (overcommit / long-runnable-without-checkpoint / low thread priority):
- Every thread involved is in a passive wait (
futex_wait_queue/do_epoll_wait/binder) — no runnable thread is being CPU-starved (223 threads parked in futex in the emulator capture alone). - The
SuspendThreadByPeerabort's own/proc/<tid>/statsnapshots show the offending thread in stateSwithutime/stimeunchanged between the two samples, at nice-8(Java priority 10) — blocked on a lock, not CPU-starved and not deprioritized. - It’s fully deterministic — it reproduces on two devices and two ART mainline versions (
371000140/Android 16 and370399999/Android 17) with the same minimal synthetic app, which is the opposite of the "extremely rare" overcommit scenario the doc describes. Raisingro.hw_timeout_multiplierwould only delay the abort, not prevent the hang.
Suggested fix direction: JVMTI free-event delivery (ObjectTagTable::Allow / SendSingleFreeEvent → commonRef_handleFreedObject) shouldn't acquire the libjdwp commonRef monitor from inside AllowNewSystemWeaks. Deferring free-event delivery until after the system-weak critical section closes — or delivering it without holding commonRef across a path that can block on GC completion — breaks the cycle.
Workarounds
Until the fix ships in an ART mainline update:
- Pin an older ART mainline version if your fleet allows it. The deadlock is absent on versionCode
361143214and earlier. - Isolate debug targets. Carve out thin, lightweight debug modules: a smaller startup footprint (fewer classes, threads, and allocations) never produces the event storm and never lets the system fall into the deadlock window.
- Diagnosis strategy. For this kind of dead-frozen runtime, don’t waste time on Java dumps — capture a native thread dump together with kernel waiting channels (
wchan) while the process is hung.
Responsible reporting
The issue was filed as a reproducible lock-ordering deadlock (ART component) with sanitized artifacts, and is publicly tracked as Issue #530992434. When publishing logs to public trackers, two sanitization rules are critical:
- Strip every identifier tying the dump to a specific app or account: package names, internal domains/hosts, user IDs, and — as I learned firsthand while preparing this data — any signed-in account emails a full
adb bugreportquietly carries along. On my own device this wasn't just the obvious Google account; grepping the raw dump also turned up a linked iCloud address (Android's Account Manager happily stores third-party account types added by sync apps, not just Google ones), plus the device serial number and Wi-Fi SSID history. A raw bugreport is not "clean" just because the crash logic in it is anonymous — grep your own dump for@gmail.com,@icloud.com, and similar before you upload anything; don't assume you know what's in there. - Ruthlessly cut raw memory dumps, the memory map, and the open-files list. The
memory nearregister-dump sections can contain arbitrary heap bytes — a real risk of leaking private strings or user data.
Takeaways
The real value here isn’t “catching a bug” — it’s the diagnostic methodology.
When a runtime is wedged so deeply that it physically can’t dump itself, you’re not blind. Looking at the process from the outside — via ptrace and per-thread kernel wait-state analysis (wchan) — lets you reconstruct the entire deadlock chain deterministically. The approach is universal: it works for any whole-VM deadlock, whenever the virtual machine loses its "sight."
And when you do file it: reproduce on more than one device, bisect the version range if you can, and scrub your bugreports before anyone else sees them.
Issue tracked publicly: issuetracker.google.com/issues/530992434
Minimal reproducer: github.com/Vitaliy69/art-jdwp-deadlock-repro
메타데이터
- post_id
- ff7b33b0334a
- slug
- how-i-found-a-deadlock-inside-art-that-art-itself-couldnt-dump-ff7b33b0334a
- url
- https://proandroiddev.com/how-i-found-a-deadlock-inside-art-that-art-itself-couldnt-dump-ff7b33b0334a
- canonical_url
- https://proandroiddev.com/how-i-found-a-deadlock-inside-art-that-art-itself-couldnt-dump-ff7b33b0334a
- author_url
- https://medium.com/@vitaliy69
- status
- ok
- fetched_at
- 2026-07-08 19:15:55