You Assume Your Logs Are Flowing.
A detection that never fires looks exactly like a peaceful night. The only way to tell the difference between “nothing is wrong” and “we…
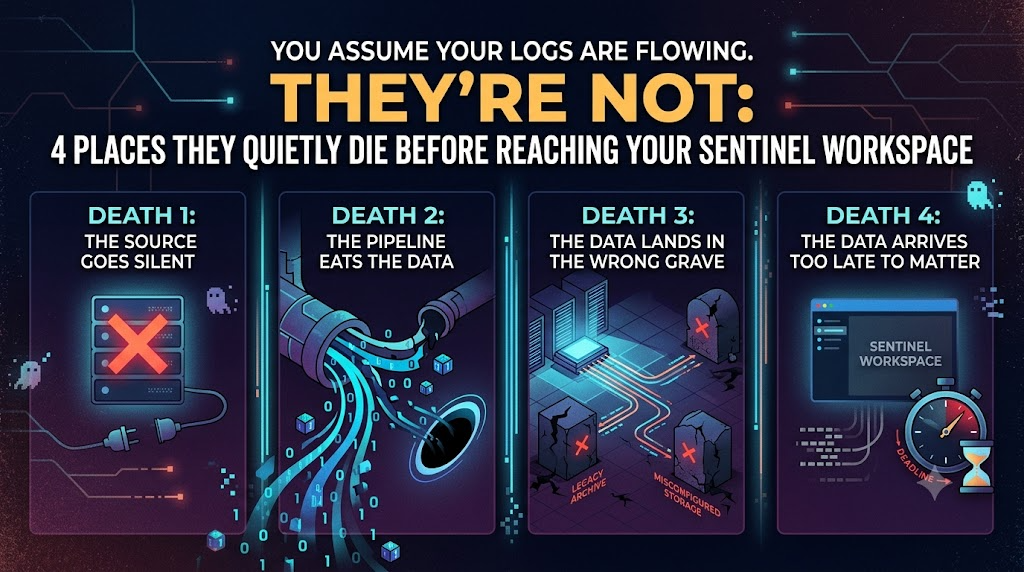
You Assume Your Logs Are Flowing. They’re Not: 4 Places They Quietly Die Before Reaching Your Sentinel Workspace
A detection that never fires looks exactly like a peaceful night. The only way to tell the difference between “nothing is wrong” and “we can no longer see” is to watch the four places where logs can quietly fail on their way into Sentinel.
There are two kinds of quiet in a SOC. One is good it is 3 a.m the queue is empty, no alerts are firing and that is because nothing bad is happening. The other looks the same but means trouble logs stopped arriving, the pipeline broke and every detection depending on those logs is now blind.
From the analyst’s view both situations look identical. That is why you need health checks for your own data pipeline. When logs stop arriving, that should become the alert before a missed detection turns into a breach.
Why this matters now
If you have been using Sentinel for a while, you may already have health checks built around older ingestion methods. Many teams used Logic Apps or Function Apps to send logs into Log Analytics through the old HTTP Data Collector API, and then watched the response codes, run history or app telemetry to confirm data was arriving.
That has changed. Microsoft is retiring the HTTP Data Collector API and the new Logs Ingestion API uses Data Collection Rules and Data Collection Endpoints instead. If you have already moved or are moving now, your data is going through a different pipeline.
That means old health checks may still look green even when the new pipeline is broken. The Logic App may succeed. The Function App may still look healthy. But if a DCR fails, filters too much data or drops rows, the old checks will never notice because they are watching the wrong path.
This guide is built for the current and future setup: DCRs, DCEs and the Logs Ingestion API. It also works for other ingestion paths, because it checks for agent failures, volume drops, latency and data landing in the wrong place.
To do that, you need to know where logs can fail on the way into Sentinel. And there are four places.

Let us walk through all four — what the death looks like, why it is invisible, and the query that catches it.
Death 1 — The source goes silent
The problem: The logs simply stop coming. An agent crashes or a server is decommissioned and nobody tells the security team. Someone flips a domain controller’s audit policy to “no auditing.” A connector quietly breaks after a credential expires. The table that had 50,000 rows per hour yesterday has zero logs today.
There is no red message, no failure log, no alert. The data jus stops and an empty table looks exactly like a quiet, healthy environment. This is the dead-battery smoke detector in its purest form.
How you catch?…..There is two ways.
First, use the heartbeats table.The best way to catch this is to watch for machines that were reporting regularly and then suddenly went silent. Instead of checking every machine that ever existed, look back over the last 7 days, find the machines that were active most of that time and flag the ones that stopped reporting today.
That gives you a much smaller and more useful list. A machine that reported for 6 out of 7 days and then disappeared is worth checking. A machine that only showed up once or twice is probably not.
let LookbackDays = 7d;
let SilenceThreshold = 4h;
let ReliabilityMinDays = 5;
let TotalDays = 7;
let StartTime = ago(LookbackDays);
let EndTime = now();
Heartbeat
| where TimeGenerated between (StartTime .. EndTime)
| summarize
    DaysActiveRaw = dcount(startofday(TimeGenerated)),
    LastHeartbeat = max(TimeGenerated),
    TotalHeartbeats = count(),
    OSType = any(OSType)
    by Computer
| extend DaysActive = min_of(DaysActiveRaw, TotalDays)
| where DaysActive >= ReliabilityMinDays
| where LastHeartbeat < ago(SilenceThreshold)
| extend
    AvgPerDay = TotalHeartbeats / todouble(TotalDays),
    HoursSilent = round(abs(datetime_diff('minute', LastHeartbeat, now())) / 60.0, 1),
    ReliabilityScore = strcat(DaysActive, " of 7 days")
| project Computer,OSType,ReliabilityScore,LastHeartbeat,HoursSilent,AvgHeartbeatsPerDay = round(AvgPerDay, 0)
Without reliability filter you get hundreds of results test machines, short-lived VMs. With it, you get a handful of results that all deserve a question. The ReliabilityScore column in the output ("6 of 7 days" or "7 of 7 days") tells you at a glance how consistently this machine was reporting before it disappeared. A "7 of 7" machine going silent is a stronger signal than a "5 of 7" machine.
Second, and more powerful use the Usage table to compare actual ingestion volumes day over day. The Usage table records how much data each table received, measured hourly. This lets you ask a very specific question: for every table in my workspace, did yesterday's volume dip compared to the day before and by how much?
let Day1Start = startofday(ago(2d));
let Day1End   = startofday(ago(1d));
let Day2Start = startofday(ago(1d));
let Day2End   = startofday(now());
let MinGB     = 0.1;
let PreviousDay =
    Usage
    | where TimeGenerated >= Day1Start and TimeGenerated < Day1End
    | where IsBillable == true
    | summarize PrevDayGB = sum(Quantity) / 1024 by TableName = DataType;
let RecentDay =
    Usage
    | where TimeGenerated >= Day2Start and TimeGenerated < Day2End
    | where IsBillable == true
    | summarize RecentDayGB = sum(Quantity) / 1024 by TableName = DataType;
PreviousDay
| join kind=fullouter RecentDay on TableName
| extend TableName    = coalesce(TableName, TableName1)
| extend PrevDayGB    = round(coalesce(PrevDayGB, real(0)), 3),
         RecentDayGB  = round(coalesce(RecentDayGB, real(0)), 3)
| where max_of(PrevDayGB, RecentDayGB) > MinGB
| extend ChangePercent = case(
    PrevDayGB == 0 and RecentDayGB > 0, real(null),
    PrevDayGB > 0 and RecentDayGB == 0, real(-100),
    PrevDayGB == 0 and RecentDayGB == 0, real(0),
    round((RecentDayGB - PrevDayGB) / PrevDayGB * 100, 1)
)
| extend DeltaGB = round(RecentDayGB - PrevDayGB, 3)
| extend Status = case(
    PrevDayGB > 0 and RecentDayGB == 0, "🚨 TABLE WENT SILENT",
    isnull(ChangePercent), "🟢 NEW TABLE",
    ChangePercent <= -50, "🔴 CRITICAL DROP",
    ChangePercent <= -20, "🟠 SIGNIFICANT DROP",
    ChangePercent <= -5, "🟡 VOLUME REDUCED",
    ChangePercent >= 100, "🔴 MAJOR SPIKE",
    ChangePercent >= 50, "🔵 UNUSUAL SPIKE",
    "Normal"
)
| where Status != "Normal"
| project TableName, PrevDayGB, RecentDayGB, DeltaGB, ChangePercent, Status
A wider lens the weekly baseline. The day-over-day check above catches sudden drops. But some tables are naturally quieter on weekends or busier on Mondays. To catch drops against the table’s own normal rhythm across a full week make it 7 day window.
Death 2 — The pipeline eats the data
The problem: Sometimes the data reaches Azure, but it never makes it into the table. A Data Collection Rule can hit a transformation error, a schema mismatch or a permissions problem and silently drop the rows.
The problem is that this usually fails quietly. Your agents or service still look healthy and sends logs to the destination, heartbeats still show up and yet the data is gone. Most people miss the important step here: turn on error logging for each Data Collection Rule so you can actually see these failures.
Once that is enabled, you can see what broke, where it broke, and why. That turns “data is missing” into a clear issue you can investigate.
DCRLogErrors
| where TimeGenerated > ago(24h)
| summarize ErrorCount = count() by OperationName, InputStreamId, Message
There is one more thing people often misunderstand not every dropped row is a problem. Sometimes a rule is supposed to filter out noise. The real warning is when rows dropped is the same as rows received, because that means nothing is getting through.
Another place pipeline failures hide is the Operation table.
DCRLogErrors catches problems inside the Data Collection Rule itself. But some failures happen after that, when the data reaches the workspace and the workspace refuses to write it. Those failures show up in the Operation table instead. They are frustrating because everything upstream can look healthy while the data is still being dropped.
Operation
| where OperationStatus == "Failed"
| where Detail has "was dropped"
| extend AffectedTable = extract(@"Data of type (.+?) was dropped", 1, Detail)
| extend DropReason = extract(@"was dropped: (.+)$", 1, Detail)
| project TimeGenerated, AffectedTable, DropReason, Detail
Two common examples are:
- Column limit exceeded. Log Analytics custom tables can only have 500 columns. If a source sends field number 501, the whole record gets dropped (we can observe this behaviour in legacy ingestion method).
- V2 custom log rejection. If a custom log was created under the newer V2 schema but the workspace cannot handle it, you get: “Data of type AlertPoller_CL was dropped: Custom log is V2, Workspace cannot be modified.” Again everything upstream looks fine the data simply vanishes at the door.
In simple terms, this table shows cases where the workspace itself rejected the data. One error may be a small issue, but repeated errors usually mean an entire data source is being lost.
There is also a failure point before both of those: the connector itself may fail to fetch the data.
This is the case where the connector is enabled, the pipeline is configured and the workspace is ready, but the source cannot be reached. It could be an expired credential, a permission change, a throttling issue or a network problem. The connector keeps trying, keeps failing and only SentinelHealth records it.
let HealthyYesterday =
    _SentinelHealth()
    | where TimeGenerated between (ago(48h) .. ago(24h))
    | where OperationName has "Data fetch"
    | where Status == "Success"
    | distinct SentinelResourceName;
_SentinelHealth()
| where TimeGenerated > ago(24h)
| where OperationName has "Data fetch"
| where Status == "Failure"
| where SentinelResourceName in (HealthyYesterday)
| extend DestinationTable = tostring(parse_json(ExtendedProperties).DestinationTable)
| extend StreamName = tostring(parse_json(ExtendedProperties).StreamName)
| summarize
    FailureCount = count(),
    FirstFailure = min(TimeGenerated),
    LastFailure  = max(TimeGenerated),
    Streams      = make_set(StreamName)
    by DestinationTable, SentinelResourceName, SentinelResourceType
In simple terms, this shows which connector failed, how many times it failed, and when the failures started. The SentinelResourceName tells you which connector it was, and ExtendedProperties often shows the exact reason, such as a 401, 429 or timeout.
This matters because a connector that cannot fetch data will not create an alert, will not appear in DCRLogErrors and will not show up in the Operation table. No data ever reaches the pipeline, so everything else can still look healthy. Only SentinelHealth reveals that the connector is failing.
Death 3—The data lands in the wrong grave
The problem: is that the data lands in a table your detections do not read. A common example is Windows security events. They should go into SecurityEvent, which is where security detections usually look. But if the setup is slightly wrong, the same events end up in the generic Event table instead.
That means the data is still being ingested, billed and stored, but it is not useful for detection because nothing is watching that table. So everything can look normal on the surface while your security coverage is actually broken.
_SentinelHealth()
| where TimeGenerated > ago(1d)
| where OperationName has "Data fetch"
| where Status == "Success"
| extend DestinationTable = tolower(tostring(parse_json(ExtendedProperties).DestinationTable))
| extend StreamName = tolower(tostring(parse_json(ExtendedProperties).StreamName))
| extend DestinationTable = replace(@"_cl$", "", DestinationTable)
| extend StreamName = replace(@"^custom-", "", StreamName)
| extend StreamName = replace(@"_cl$", "", StreamName)
| where isnotempty(DestinationTable) and isnotempty(StreamName)
| summarize
    LastSeen   = max(TimeGenerated),
    FetchCount = count()
    by DestinationTable, StreamName, SentinelResourceName, SentinelResourceType
| where DestinationTable !=StreamName
This is hard to spot because the usual health checks may all look fine. Heartbeats are good, there are no pipeline errors, data volume looks normal and the dashboard may still be green. But the data is going to the wrong place, so your detections are blind.
A good example is logons, privilege use, and account changes. Those should be in SecurityEvent. If they show up in Event instead, that is a sign the collection is misconfigured and your detections may miss them.
A note on what SentinelHealth does and does not cover.
The stream-to-table checks above only work for connectors that pull data from an API, like Office 365, AWS, Defender and other cloud services. They do not track agent-pushed data sources like CommonSecurityLog, Syslog or SecurityEvent because there is no fetch step for SentinelHealth to observe.
For those sources, use the usage baseline from earlier to catch volume drops at both the table level and the source level. That helps spot things like one firewall going quiet while the rest still look normal.
You should also check your DCR rules manually. Open each rule in the portal and make sure the output stream is sending data to the correct table. A wrong output stream is one of the most common reasons data lands in the wrong place after a migration, and it is easy to miss unless you check it directly.
Death 4 — The data arrives too late to matter
The Problem: The data reaches the right table, but it arrives late. Sometimes it is only a few minutes late and sometimes it is hours late. That may not matter for a report that runs tomorrow, but it is a problem for near-real-time detections that only look at the last few minutes. If the log shows up an hour late, the rule already missed it.
This is hard to notice because the data is still there, so everything looks healthy. Heartbeats are fine, the table has data, and the dashboard may still look green. The only problem is timing and timing is easy to miss unless you measure it.
The way to catch it is to compare when the event happened with when Sentinel actually ingested it. Every row has both timestamps: TimeGenerated and ingestion_time(). The gap between them shows your real ingestion delay.
union
    (SecurityEvent | where TimeGenerated > ago(6h)
        | extend TableName = "SecurityEvent"),
    (SigninLogs | where TimeGenerated > ago(6h)
        | extend TableName = "SigninLogs"),
    (CommonSecurityLog | where TimeGenerated > ago(6h)
        | extend TableName = "CommonSecurityLog"),
    (AuditLogs | where TimeGenerated > ago(6h)
        | extend TableName = "AuditLogs")
| extend LagMinutes = round(datetime_diff('second', ingestion_time(), TimeGenerated) / 60.0, 1)
| where LagMinutes > 0
| summarize
    AvgLagMinutes = round(avg(LagMinutes), 1),
    p95LagMinutes = round(percentile(LagMinutes, 95), 1),
    MaxLagMinutes = round(max(LagMinutes), 1),
    RecordCount   = count()
    by TableName
| extend Status = case(
    p95LagMinutes > 60,  "CRITICAL DELAY — >1h",
    p95LagMinutes > 15,  "HIGH DELAY — >15m",
    p95LagMinutes > 5,   "MODERATE DELAY — 15m",
    "Healthy")
| project TableName, AvgLagMinutes, p95LagMinutes, MaxLagMinutes,RecordCount, Status
This measures how long data took to arrive at each of your key tables. The p95 column is the one that matters most it tells you "95% of records arrived within this many minutes." An average of 2 minutes but a p95 of 45 means most data is fine but a chunk is arriving very late and that chunk is the window your NRT rules are blind to. Add or remove tables from the union to match what your detections depend on.
Turning checks into assurance
Running these queries once gives you a health check. Running them automatically, all the time gives you real assurance. Once the pieces are in place, the next step is to build a workbook that shows everything in one place.
Step 1: Turn on logging: Turn on error logging for your Data Collection Rules and workspace diagnostic settings. Without this foundation, you are completely blind to silent failures.
Step 2: Build a baseline: Learn the normal patterns of your most critical tables. Don’t try to baseline everything — focus strictly on the data sources your key detections depend on.
Step 3: Alert on missing data:Watch for what isn’t there. Treat a suddenly quiet table, a missing heartbeat, or a spike in ingestion errors as immediate warning signs.
Step 4: Notify a Human:Route critical alerts (like a dead pipeline or a key table going silent) directly to a person. Keep lower-priority anomalies in a workbook for periodic review.
Bonus: A broken pipeline and a sabotaged one look identical. Monitoring for configuration changes, disabled connectors, or reduced retention detects both accidental failures and malicious tampering.
Closing Thoughts
The core challenge of a SOC is telling them apart knowing at 3:00 AM whether an empty queue means a peaceful night or a blind one.
Every detection you write assumes data is flowing. When the data stops, your rules don’t fail loudly they just go silent. And that silence looks exactly like safety.
These four checks are the battery test for your smoke detector. They are the unglamorous discipline that earns you the right to trust the quiet.
Don’t just watch your detections watch the rivers that feed them. A watchtower is worthless if someone silently drained the river it was built to guard.
메타데이터
- post_id
- a6e8971b676c
- slug
- you-assume-your-logs-are-flowing-a6e8971b676c
- url
- https://detect.fyi/you-assume-your-logs-are-flowing-a6e8971b676c
- canonical_url
- https://detect.fyi/you-assume-your-logs-are-flowing-a6e8971b676c
- author_url
- https://medium.com/@rohitashokgowd
- status
- ok
- fetched_at
- 2026-08-12 12:54:48