Part 1B.3: Visual Studio Profiler — CPU Usage
Call Tree View Deep Dive: Tracing Hot Paths and Finding the Real CPU Bottleneck
Part 1B.3: Visual Studio Profiler — CPU Usage
Call Tree View Deep Dive: Tracing Hot Paths and Finding the Real CPU Bottleneck
In the previous parts of this CPU Usage series, we looked at two important views:
- Functions View — to identify which methods consumed the most CPU
- Caller/Callee View — to understand who called a method and what it called next
Both are extremely useful. But sometimes they are not enough.
The Functions View gives you a flat list of expensive methods.
The Caller/Callee View gives you one method at a time.
But what if you want to see the complete execution path?
What if you want to start from the top of your application and follow the CPU cost all the way down to the exact method where the real work is happening?
That is where the Call Tree View becomes powerful.
The Call Tree View helps you answer one of the most important profiling questions:
How did the application reach this CPU hotspot?
What Is the Call Tree View?
The Call Tree View shows your application’s execution as a hierarchy.
Instead of showing methods as a flat list, it shows how methods called each other.
Think of it like this:
Application entry point
           ↓
Controller / Service method
           ↓
Business logic
           ↓
Helper methods
           ↓
Framework or library calls
This makes the Call Tree View especially useful when you want to understand the complete path that led to a performance problem.
The Functions View tells you which methods are expensive.
The Caller/Callee View tells you what happened immediately around one method.
The Call Tree View shows you the full execution story.
A Simple Analogy
Think of your application like a company.
The Functions View is like a list of employees ranked by how busy they were.
The Caller/Callee View is like looking at one employee’s manager and direct reports.
The Call Tree View is like looking at the full company org chart from the top down.
You can see every level, every branch, and how work flows from one layer to another.
That is exactly why Call Tree is so useful during CPU investigations.
When Should You Use the Call Tree View?
Use the Call Tree View when:
- You want to understand the complete execution path
- You want to follow CPU usage from top-level code to leaf methods
- You need to identify the hottest call chain
- You want to understand whether CPU cost is coming from your code, framework code, or a third-party library
- You are investigating a complex request flow where many methods are involved
Do not use Call Tree only to find the top CPU method. For that, Functions View is usually faster.
Use Call Tree when you want to understand how execution reached the hotspot.
How to Open the Call Tree View
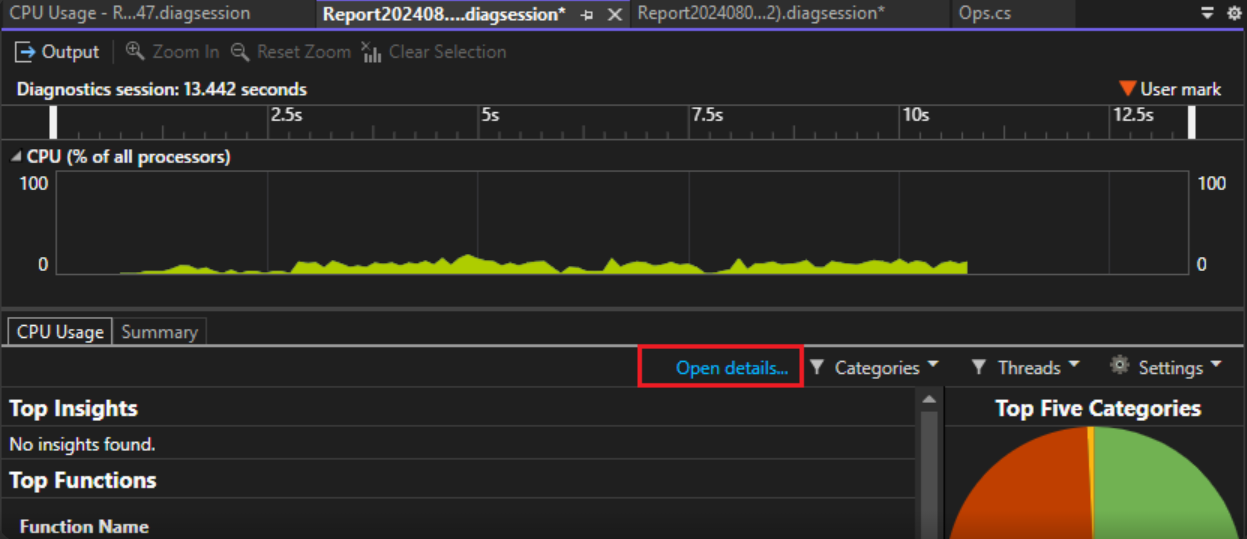
Summary Page → Open Details → Current View dropdown → select "Call Tree"
You can also reach it from another detailed view. For example, from the Functions View or Caller/Callee View:
Right-click a function → View in Call Tree
Visual Studio then scrolls to that function inside the call tree and highlights it.
This is helpful when you already know the expensive method and want to understand where it sits in the full execution hierarchy.
How to Read the Call Tree Structure
A typical Call Tree may look like this:
[Your App Process]
        ↓
[External Code]
        ↓
YourController.GetData()
        ↓
OrderService.ProcessOrder()
        ↓
DeserialisePayload()
        ↓
JsonConvert.Deserialize()
In many applications, the tree starts with the process node at the top.
Then you may see framework or runtime code. After that, you eventually reach your own application code.
From there, you can expand deeper into child methods.
A practical way to read the tree is:
Start from the top
        ↓
Expand the highest CPU branch
        ↓
Keep following the dominant child node
        ↓
Stop when CPU no longer moves deeper
In simple terms:
Keep expanding the branch where most of the CPU is going.
Important Note About the “4 Levels”
You may often see a pattern like this:
Level 1 → Application process
Level 2 → External/framework code
Level 3 → Your application method
Level 4 → Child methods called by your code
But treat this as a mental model, not a strict rule. Real Call Tree reports may look different depending on:
- application type
- framework
- async code
- external code visibility
- Just My Code settings
- compiler optimizations
- available symbols
So instead of memorizing fixed levels, focus on the flow:
Process → Runtime/framework code → Your code → Child methodsThat mental model works better in real profiling sessions.
Columns in the Call Tree View
The Call Tree View uses familiar columns such as:
- Total CPU
- Total CPU [%]
- Self CPU
- Self CPU [%]
- Module
These are similar to the Functions View, but they must be interpreted in the context of the hierarchy. That difference is important.
In Functions View, you see methods independently.
In Call Tree, each row is part of a parent-child relationship.
So the question is not only:
How expensive is this method?
The better question is:
Is this method expensive by itself, or is it passing CPU cost to its children?

The Core Decision Rule

Example:
GetBlogTitleX() Total CPU: 59.48% Self CPU: 0.10%This method looks expensive because its Total CPU is high. But its Self CPU is almost zero. That means the method itself is not doing much work.
The real CPU cost is likely inside one of its child methods.
Now look deeper:
GetBlogTitleX()
↓
LINQ DLL calls Total CPU: 41.91% Self CPU: 41.91%
Here, Total CPU and Self CPU are almost the same.
That usually means the CPU cost is being spent inside this method or library call itself.
This is where your investigation becomes more focused.
Practical Rule
If you see this:
High Total CPU
Low Self CPU
do not stop. Keep expanding.
If you see this:
High Total CPU
High Self CPU
slow down and inspect that method carefully. That method may be close to the real bottleneck.
Hot Path — The Most Important Feature of Call Tree
The Call Tree can become very large. In a real application, you may see hundreds or thousands of nodes. Manually expanding every branch is painful.
That is why Visual Studio provides the Hot Path feature. The Hot Path is the call path that consumed the highest percentage of CPU.
Visual Studio marks it using a flame icon 🔥.
This helps you quickly follow the most expensive execution path without manually guessing which branch to expand.
Click the Expand Hot Path and Show Hot Path buttons to see the function calls that use the highest percentage of the CPU in the call tree view.

Two buttons appear at the top of the Call Tree view:

How to Use Hot Path Correctly
A good workflow looks like this:
Step 1 → Open Call Tree view
          ↓
Step 2 → Click "Expand Hot Path"
          ↓
Step 3 → Visual Studio automatically opens every node on the most expensive path
          ↓
Step 4 → Follow the 🔥 flame icons downward through the tree
          ↓
Step 5 → At each node, compare Total CPU and Self CPU
          ↓
Step 6 → Stop when you reach a node where Self CPU% is HIGH
          and there are no more expensive children below it
          ↓
          That node is your hotspot
The goal is not just to reach the deepest node.
The goal is to find where CPU cost stops being passed downward and starts being spent directly.
That node is usually where your optimization work begins.
Hot Path Does Not Automatically Mean “Fix This Line”
This is important.
Hot Path tells you where CPU was concentrated. It does not automatically tell you the correct fix.
For example, if the hot path ends in a framework or library method, the problem may not be the framework itself.
It may be your code calling it too often. Or passing too much data. Or using it inefficiently.
So treat Hot Path as a direction, not a final conclusion.
External Code in the Call Tree
External code usually represents framework, runtime, system, or third-party code executed by your application.
By default, all framework calls are collapsed into one [External Code] node so your own code is easier to read.
This is useful for beginners because it reduces noise. But sometimes the real bottleneck is hidden inside external code.
For example:
- JSON serialization
- LINQ operations
- regex processing
- framework routing
- database client libraries
- third-party SDKs
In those cases, you may need to expand external code.
How to Toggle External Code
Main report summary page (right pane) → Settings dropdown (top right)
→ Deselect "Show Just My Code" → Click Apply

After this, Visual Studio expands more framework and external call paths.

When to turn it OFF:

A practical approach is:
Start with Just My Code ON
        ↓
Find your main hotspot
        ↓
If CPU disappears into external code, turn it OFF
        ↓
Inspect the expanded call path
This keeps the investigation focused without hiding important details.
Async Functions in the Call Tree
Async code is one of the most confusing parts of Call Tree analysis.
When you write an async method in C#, the compiler transforms it into a state machine behind the scenes.
Because of this, async methods may not appear exactly where you expect them in the tree.
For example, a normal synchronous method may appear like this:
YourController.GetData()
        ↓
OrderService.ProcessOrder()
        ↓
DeserialisePayload()
But an async method may appear under framework or external code:
[External Code]
   ↓
MoveNext()
   ↓
ProcessOrderAsync()
This happens because async execution is controlled by compiler-generated state machine methods.
What Beginners Should Remember
If you search for your async method and cannot find it where you expect:
Expand [External Code]
↓
Look for MoveNext()
↓
Expand it
↓
Find your async method inside
It means the async execution path is represented differently.
This is one of the most common surprises when reading Call Tree reports for the first time.
Release Build Optimization — Method Inlining
Another reason a method may not appear in the Call Tree is method inlining.
In Release builds, the JIT compiler may inline small methods.
Inlining means the compiler merges a small method into its caller instead of keeping it as a separate method call.
Example:
// Your code:
int result = CalculateDiscount(order);

// If CalculateDiscount() is small, the JIT may inline it.

// In the Call Tree, you may see:

 ProcessOrder()     Self CPU: 18%

// But you may not see:

// CalculateDiscount()
That does not mean CalculateDiscount() did not execute. Its CPU cost may have been absorbed into ProcessOrder().
Should You Switch to Debug Mode to See Inlined Methods?
Sometimes Debug mode can make small methods appear more clearly because fewer optimizations are applied.
But be careful.
Debug results do not represent production performance. For real performance analysis, profile Release builds whenever possible.
Use Debug mode only when you need to understand code structure temporarily — not to make final performance conclusions.
Broken Code / Unwalkable Stack Warning
Sometimes you may see entries like:
[Broken code]
[Unwalkable stack]
This usually does not mean your application code is broken. It often means the profiler could not fully reconstruct part of the call stack.
One common reason is dropped ETW(Event Tracing for Windows) events during collection, especially under heavy load.
If this happens, try collecting the same trace again. If the issue disappears, it was likely a profiling artifact.
If it keeps appearing, check:
- profiling overhead
- machine load
- trace duration
- symbol availability
- whether the workload is too heavy during collection
Do not immediately assume your code is wrong. First confirm that the trace itself is reliable.
Compiler-Generated Code in the Call Tree
Sometimes the Call Tree shows method names that look strange:
<>c__DisplayClass4_0.<ProcessOrder>b__0    ← compiler-generated LINQ lambda
<ProcessOrderAsync>d__12.MoveNext()        ← async state machine
get_CustomerName()                         ← auto-property getter
These names may not look like methods you wrote directly, but they still represent real work happening inside your application.
For example:
<MethodName>b__N --> A lambda or anonymous method inside MethodName

<MethodNameAsync>d__N.MoveNext() --> The async state machine for an await call

<>c__DisplayClass --> A closure — a lambda that captured a local variable

get_PropertyName() --> An auto-property getter called on a hot path
Do not ignore these methods just because the names look unusual. If one of them has high Self CPU, try to map it back to the original source pattern:
- LINQ query
- lambda expression
- async method
- property access
- iterator
- event handler
Compiler-generated code does not mean irrelevant code. It simply means the compiler generated part of the execution structure for you.
Sampling and Fast Functions
The CPU Usage tool is sampling-based.
That means Visual Studio periodically captures what is running and uses those samples to estimate where CPU time was spent.
This is efficient and useful for most CPU investigations.
But it has one limitation:
Very fast methods may not appear in the Call Tree.
If a method executes quickly and finishes between profiler samples, Visual Studio may never catch it running.
So absence from the Call Tree does not always mean:
This method never executed.
It may simply mean:
This method executed too quickly to be sampled.
When Sampling Is Not Enough
If you need to see every method call exactly, use the Instrumentation tool instead.
Instrumentation measures every call. But it has higher overhead than sampling.
So the practical rule is:
Use CPU Usage sampling
→ for most high-level CPU investigations

Use Instrumentation
→ when you need exact call counts or very short-lived method visibility
Sampling is usually the right starting point.
Instrumentation is useful when sampling does not provide enough detail.
Full Investigation Workflow Using Call Tree
Here is a practical workflow you can follow:
Step 1 → Open Call Tree View
          ↓
Step 2 → Click "Expand Hot Path"
          ↓
Step 3 → Follow 🔥 icons — start from your code at Level 3
          ↓
Step 4 → At each node: check Self CPU%
         → Low Self CPU → keep expanding children
         → High Self CPU → you found it
          ↓
Step 5 → Hit a node where Self CPU% ≈ Total CPU% and no more children
          ↓
Step 6 → Double-click that node → source code opens with hot lines highlighted
          ↓
Step 7 → Verify: is this your code, a library, or a framework call?
         → Your code   → fix the logic directly
         → Library     → find a faster alternative
         → Framework   → reduce how often your code calls it

Step 8 → Form a hypothesis

Step 9 → Apply one change

Step 10 → Re-profile the same workload
The most important part is Step 10. A profiler does not just help you find the problem. It also helps you prove that your fix worked.
Example Investigation
Suppose the Call Tree shows:
GetBlogTitleX()
Total CPU: 59.48%
Self CPU:  0.10%
This means GetBlogTitleX() is expensive overall, but not because of its own method body.
So you expand deeper. You then see:
LINQ-related calls
Total CPU: 41.91%
Self CPU:  41.91%
Now the picture becomes clearer.
The expensive work is inside the LINQ path, not inside the parent method itself.
A responsible investigation would ask:
- Is the LINQ query processing too much data?
- Is it running inside a loop?
- Is it causing repeated enumeration?
- Can the query be simplified?
- Can the result be cached?
- Can the data be filtered earlier?
After applying a fix, you profile again. If CPU drops from 59% to 37%, you now have evidence that the change worked.
That is the correct performance engineering loop:
Measure
    ↓
Identify
    ↓
Hypothesize
    ↓
Fix
    ↓
Validate
Common Mistakes to Avoid
Mistake 1 — Stopping at High Total CPU
High Total CPU only tells you that the method and its children are expensive overall.
It does not prove that the method itself is the problem. Always compare Total CPU with Self CPU.
Mistake 2 — Ignoring Low Self CPU
A method with low Self CPU may still be important. It may be the gateway to expensive child calls.
Do not optimize it directly. Use it as a path to the deeper bottleneck.
Mistake 3 — Blaming External Code Immediately
If a library or framework method appears expensive, do not immediately blame the library.
Your code may be:
- calling it too often
- passing too much data
- using it inefficiently
- forcing repeated work
Investigate usage before replacing the library.
Mistake 4 — Assuming Missing Methods Did Not Execute
A method may be missing because of:
- sampling behavior
- method inlining
- missing symbols
- external code filtering
- async state machine transformation
Do not conclude too quickly.
Mistake 5 — Profiling Once and Trusting Everything
Performance data can vary.
Always run the same scenario multiple times when possible. Look for repeatable patterns. One trace gives you a clue.
Repeated traces give you confidence.
Part 1B.3 Summary
The Call Tree View is one of the most useful views in Visual Studio CPU profiling because it shows how CPU work flows through your application.
Use it when you want to understand the complete execution path, not just an isolated method.
The key ideas are:
High Total CPU + Low Self CPU
→ Keep drilling into child methods

High Total CPU + High Self CPU
→ Inspect the selected method carefully

Hot Path
→ Follow the most expensive execution path

External Code
→ Expand it when the real cost may be hidden inside framework or library calls

Async Code
→ Look for MoveNext() and compiler-generated state machines

Sampling
→ Remember that very fast methods may not appear
The Call Tree View helps you move from:
This method is expensive
to:
This is the execution path that made it expensive.
That is a major step toward root-cause analysis.
What’s Next?
The Call Tree View helps you follow the full execution path and identify the hot path.
But sometimes the question is not:
Which method is expensive? or Which call path is expensive?
Sometimes the question is:
Which assembly or module is consuming most of the CPU?
Is the cost mostly in your application DLL?
Is it in the .NET runtime?
Is it in a third-party library?
That is where the Modules View becomes useful.
In Part 1B.4, we will deep dive into the Modules View and learn how to separate CPU hotspots across:
- your application code
- framework libraries
- third-party dependencies
- runtime modules
The Functions View tells us what is expensive.
The Caller/Callee View explains why a selected method is expensive.
The Call Tree View shows how expensive work flows through the application.
The Modules View shows where that cost lives at the assembly level.
Series Roadmap
✅ Part 1.1 — Profiling Tools for .NET Performance Engineers
✅ Part 1A — Visual Studio Profiler — CPU Usage: Setup, Configuration, and Collecting Your First Trace
✅ Part 1B.1 — Visual Studio Profiler — CPU Usage: Functions View Deep Dive
✅ Part 1B.2 — Visual Studio Profiler — CPU Usage: Caller/Callee View Deep Dive
✅ Part 1B.3 — Visual Studio Profiler — CPU Usage: Call Tree View Deep Dive
⬜ Part 1B.4 — Visual Studio Profiler — CPU Usage: Modules View Deep Dive
⬜ Part 1B.5 — Visual Studio Profiler — CPU Usage: Flame Graph View Deep Dive
메타데이터
- post_id
- f5b6790584f2
- slug
- part-1b-3-visual-studio-profiler-cpu-usage-f5b6790584f2
- url
- https://medium.com/@satnamgoldi/part-1b-3-visual-studio-profiler-cpu-usage-f5b6790584f2
- canonical_url
- https://medium.com/@satnamgoldi/part-1b-3-visual-studio-profiler-cpu-usage-f5b6790584f2
- author_url
- https://medium.com/@satnamgoldi
- status
- ok
- fetched_at
- 2026-08-04 03:03:18