How the misuse of statistics can cause mistaken decision-making
Brazil lost before they lost: disastrous cycle, ignored data, and long-term strategy
How the misuse of statistics can cause mistaken decision-making

Brazil lost before they lost: disastrous cycle, ignored data, and long-term strategy
Well-used Data transforms campaigns. But Data used without context can do the opposite: justify the wrong choice with the appearance of rigor. In Marketing, the problem is rarely the lack of numbers. It is the lack of intelligence in reading them.
Isolated metrics, small samples, and indicators without historical data serve as the basis for daily decisions. And when the result does not come, the blame falls on the strategy, not on the way the data was interpreted.
A 30-second decision that summarizes four years
In a difficult game with a bad start, a golden opportunity appeared for Brazil, still in the first half: a penalty in their favor.
To the surprise of many, the penalty taker was not Vinicius Júnior, the team’s star, but Bruno Guimarães, who had been having an excellent World Cup but does not have goal-scoring as a major virtue. The result: a missed penalty. Unable to impose itself, Brazil saw Norway dominate the game and win 2–1.
In explaining the decision, coach Carlo Ancelotti stated that he followed the coaching staff’s numbers. The gathered data pointed to Bruno Guimarães as the best option available on the pitch at that moment. The decision may even seem logical. But looking only at the numbers can be treacherous.
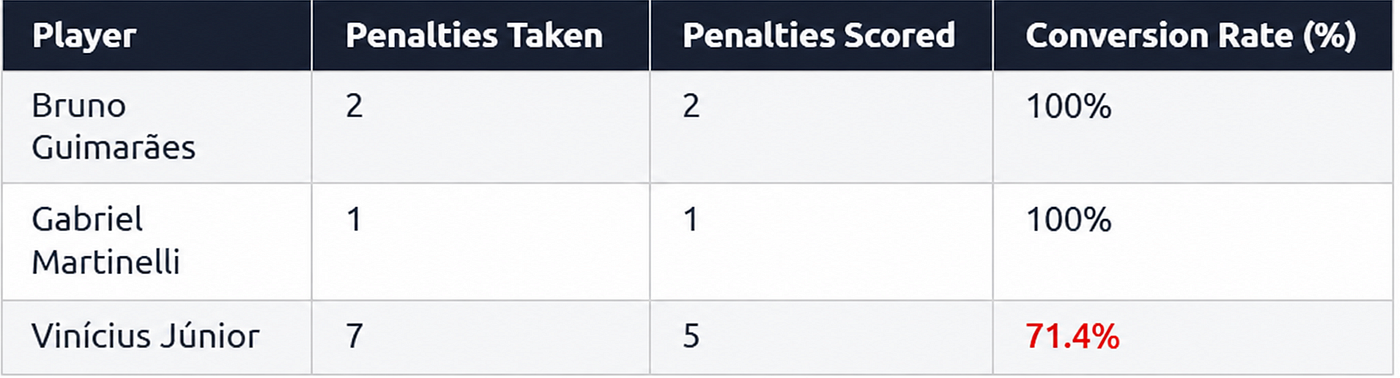
Source: Transfermarkt. Data from the 25/26 season.
The main mistake was comparing incomparable samples and ignoring the weight of experience.
Bruno Guimarães and Gabriel Martinelli had a 100% success rate, but based on two and one spot kicks, respectively. Vinicius Júnior went to the penalty spot seven times during the season and converted five.
In practice, Vinicius was the player most accustomed to handling the responsibility of a penalty kick under real pressure. In addition, the statistics used by the coaching staff were collected in a calm and controlled training environment, completely different from the tension of a World Cup knockout match. The analysis disregarded an essential factor: context.
But this was not an isolated accident
The same logic that chose Bruno Guimarães over Vinícius Júnior was present throughout the Brazilian national team’s entire cycle. Data without context, reaction to immediate results, and lack of trend analysis. It was not a one-off thirty-second failure. It was a four-year pattern.
Four years, four bets, no continuity
Since 2022, Brazil has changed its strategy with each cycle. Each new cycle arrived with a different style of play, a new set of starting players, and a new decision-making logic.
In the short term, each change seemed to make sense. In the long term, what accumulated was instability, and instability does not show up on the scoreboard of a single game. It appears in the pattern. The 1–2 against Norway was where the pattern showed itself.
The immediate reaction trap
Short-term failures end up defining long-term decisions. This is what happens when a bad result becomes a trigger for change before there is enough data to understand what caused that result.
In Brazil, there were four coaching staffs in four years. Each change was a response to a moment, never to a reading of the cycle. The team that went to the 2026 World Cup was still figuring out who they were when the World Cup began.
In Marketing, this pattern appears every time a company changes its media strategy, tool, or KPI right after a lower-than-expected result. The decision seems rational, but what it does is erase the history before it has anything to say.
The scoreboard does not lie. But it also does not explain anything.
A lagging indicator is the scoreboard. It confirms what has already happened, and you cannot act on it, only record it. A leading indicator is what happens before the scoreboard: possession given away, a sequence of unsuccessful substitutions, the pattern of goals conceded in the last fifteen minutes.
It anticipates. Decisions should be made based on it. Bruno Guimarães’ 100% success rate was a lagging indicator built on a sample of two penalties. It seemed solid.
It was not. The same thing happens when a marketing team celebrates a green month without realizing that the retention rate has been falling for weeks.
Brazil spent the entire cycle looking at the lagging indicator. It changed the coaching staff four times, always after a bad result, never before it happened. None of the changes were based on a trend reading. All were reactions to the scoreboard.
This pattern did not start in 2022. Since 2006, with every cycle that does not end as expected, the response is the same: change who is at the top and maintain the logic that produced the problem. In marketing, it works the same way.
When the green dashboard hides the real problem
The Brazilian national team is not the only one that reacts to the scoreboard without reading what is behind it. Marketing teams do the same, and with a surprising frequency. When a KPI is changed in the middle of a campaign, more than just a number is lost.
The history built around that indicator is lost, and, most importantly, the ability to understand what a lower-than-expected result was trying to say. A negative result is not just a sign that something went wrong. It is a source of information about the audience, product, and market that rarely appears in any other way.
This applies to any data-driven decision: defining a marketing strategy for a new product without waiting for the data cycle to mature, changing the channel mix after a bad month, or abandoning a segmentation before it has enough volume to speak.
In all of these situations, the search for an immediate answer ends up interrupting a learning cycle that has barely had time to consolidate itself. The point is not to create rigidity. It is to create reflection before making a change. Understanding whether what looks like a failure is not just a short-term result and whether, from it, there is enough information to sustain the process until the actual goal.
The advantage of those who see beyond the result
A data strategy is not what you do after the result. It is what you build before.
Norway did not reach the quarter-finals by accident. They reached it because they maintained a consistent system over the years, measured the entire cycle, and made decisions before the scoreboard forced them to. Brazil reached it because they have talent. Talent without a system produces emotion, not consistency.
Marketing teams with analytical maturity function like Norway. Not because they have more data, but because they know what to do with it over time. They build history instead of erasing it. They read trends instead of reacting to isolated points. They decide before the dashboard turns red.
Companies that escape this cycle do not do it alone. They seek an analytical consultancy that can map the indicators preceding the result, build history before changing strategies, and ensure that the next bad result becomes a learning experience, not a trigger.
DP6 works exactly on this. If your company still discovers problems through the scoreboard, maybe it is time to talk to those who read the game before the final whistle. **Contact us!**

Author Photo
Profile of the Author: Thiago Souza | Graduated in Marketing and post-graduated in Software Architecture, Data Science, and Cybersecurity. With over 8 years of experience in Data Analysis and Business Intelligence, he currently works as a Data Engineer at DP6.

Author Photo
Profile of the Author: Wellington Lima | Works as a consultant at DP6 in addition to pursuing a bachelor’s degree in Computer Engineering.
Originally published at https://www.dp6.com.br.
메타데이터
- post_id
- 063909de81b6
- slug
- how-the-misuse-of-statistics-can-cause-mistaken-decision-making-063909de81b6
- url
- https://medium.com/dp6-us-blog/how-the-misuse-of-statistics-can-cause-mistaken-decision-making-063909de81b6
- canonical_url
- https://medium.com/dp6-us-blog/how-the-misuse-of-statistics-can-cause-mistaken-decision-making-063909de81b6
- author_url
- https://medium.com/@dp6blog
- status
- ok
- fetched_at
- 2026-07-17 23:26:04