Article 4: Building the Docker Containers Dashboard in Grafana
Once you can see the host and the network, the final step is to make Docker itself observable. This is where cAdvisor becomes valuable…
Article 4: Building the Docker Containers Dashboard in Grafana
Once you can see the host and the network, the final step is to make Docker itself observable. This is where cAdvisor becomes valuable. cAdvisor collects and exports information about running containers, including resource usage and network statistics, and it exposes those metrics on a Prometheus endpoint by default.
The goal of this dashboard is simple: stop thinking in terms of “the box is slow” and start seeing which container is responsible.
Step 1: Confirm that cAdvisor is being scraped
Before building panels, verify that the data exists.
In Grafana Explore, run:
up{job="cadvisor"}You want 1.
Then test:
container_memory_working_set_bytes{name!=""}and
container_cpu_usage_seconds_total{name!=""}If both return data, you are ready to build the dashboard.
Step 2: Create the dashboard and container variable
Create a new dashboard. Then add a variable:
- Name:
container - Label:
container - Type:
Query - Query type:
Classic query - Data source:
Prometheus
Use:
label_values(container_last_seen{name!=""}, name)Turn on Include All option and save.
Grafana’s template variables exist specifically so you can change dashboard scope from a top-level dropdown instead of editing every panel.
If that variable comes back empty, try:
label_values(container_memory_working_set_bytes{name!=""}, name)Step 3: Add the “Container CPU %” panel
Container CPU usage is based on a counter, so again, the right approach is rate() over a time window, then aggregation. Prometheus’ guidance on rate() and aggregation applies here, too.
Use:
sum by (name) (
  rate(container_cpu_usage_seconds_total{name=~"$container",image!=""}[5m])
) * 100
Set:
- Visualization:
Time series - Title:
Container CPU % - Unit:
Percent (0-100) - Legend:
{{name}}
The image!="" filter removes some noise and helps focus the panel on real containers.
Step 4: Add the “Container Memory” panel
Use:
sum by (name) (
  container_memory_working_set_bytes{name=~"$container",image!=""}
)
Set:
- Visualization:
Time series - Title:
Container Memory - Unit:
bytes (IEC) - Legend:
{{name}}
This is one of the most useful panels in the whole stack because it shows which containers are consuming working memory right now.
Step 5: Add “Top 10 Containers by CPU”
Use:
topk(
  10,
  sum by (name) (
    rate(container_cpu_usage_seconds_total{name!="",image!=""}[5m])
  ) * 100
)
Set:
- Visualization:
Bar chart - Title:
Top 10 Containers by CPU - Unit:
Percent (0-100)
This is your quick ranking view when the host CPU is high and you want to know who is responsible.
Step 6: Add “Top 10 Containers by Memory”
Use:
topk(
  10,
  sum by (name) (
    container_memory_working_set_bytes{name!="",image!=""}
  )
)
Set:
- Visualization:
Bar chart - Title:
Top 10 Containers by Memory - Unit:
bytes (IEC)
This gives you the same kind of triage view for memory pressure.
Step 7: Add “Container Network IO”
cAdvisor exposes container and hardware metrics on /metrics, including network statistics. That means you can chart receive and transmit rates per container the same way you did for host interfaces.
Add Query A:
sum by (name) (
  rate(container_network_receive_bytes_total{name=~"$container"}[5m])
)
Legend:
RX {{name}}Add Query B:
sum by (name) (
  rate(container_network_transmit_bytes_total{name=~"$container"}[5m])
)
Legend:
TX {{name}}Set:
- Visualization:
Time series - Title:
Container Network IO - Unit:
bytes/sec
Step 8: Arrange the dashboard
Top row:
- Container CPU %
- Container Memory
Second row:
- Top 10 Containers by CPU
- Top 10 Containers by Memory
Third row:
- Container Network IO
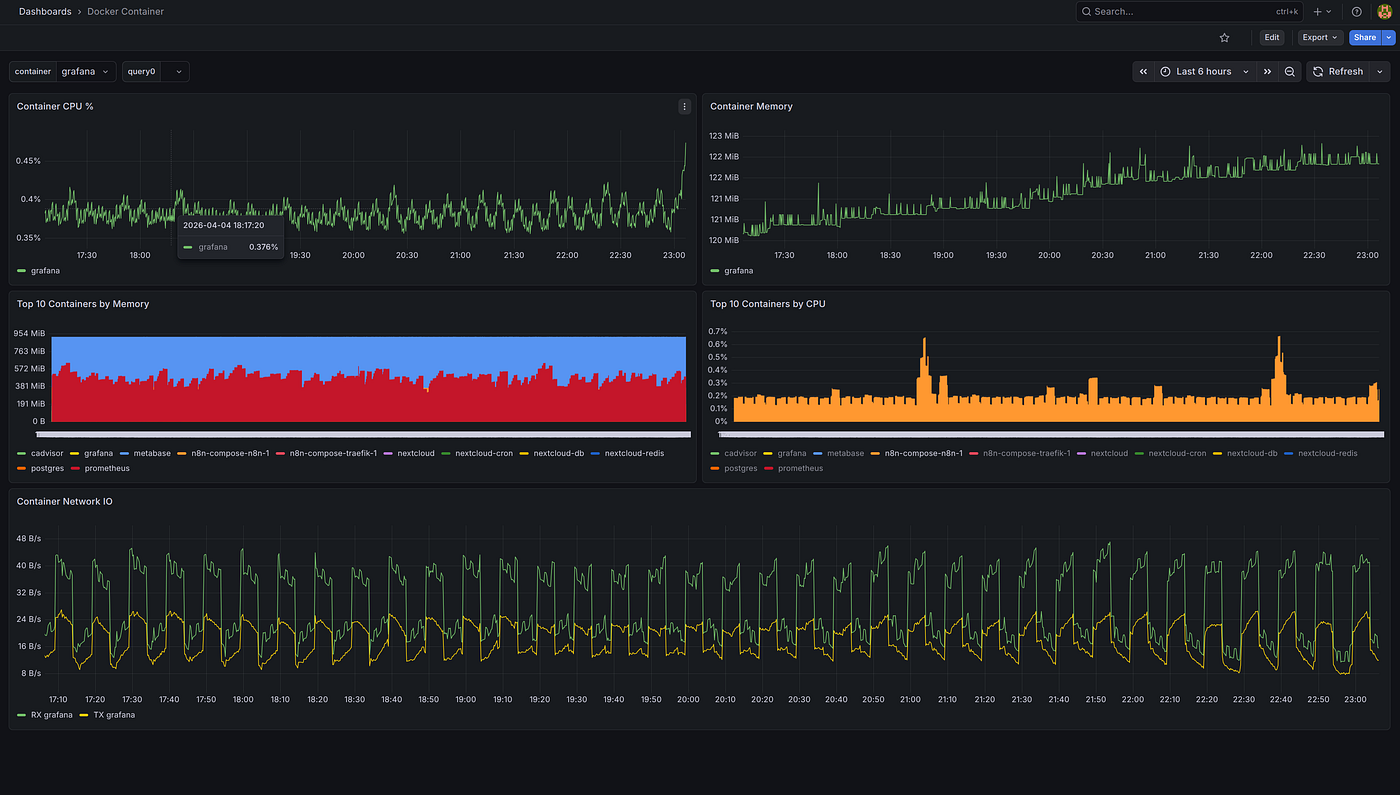
This gives you a clean operational flow: current behaviour at the top, ranked offenders in the middle, network behaviour at the bottom.
Step 9: Troubleshooting if a panel shows no data
Go to Explore and check these in order:
up{job="cadvisor"}container_last_seencontainer_memory_working_set_bytescontainer_cpu_usage_seconds_totalcontainer_memory_working_set_bytes{name!=""}If the raw metric works but the filtered one does not, the issue is usually the label you are grouping on. In that case, inspect the raw series labels in table view and adjust your grouping label.
Why this dashboard matters
This is the dashboard that turns Docker into something operationally understandable. The host dashboard tells you the machine is under pressure. The containers dashboard tells you exactly which service is causing it. That is where this monitoring project starts to pay off in a very practical way.
메타데이터
- post_id
- 35ee4beec810
- slug
- article-4-building-the-docker-containers-dashboard-in-grafana-35ee4beec810
- url
- https://medium.com/@SQLShark/article-4-building-the-docker-containers-dashboard-in-grafana-35ee4beec810
- canonical_url
- https://medium.com/@SQLShark/article-4-building-the-docker-containers-dashboard-in-grafana-35ee4beec810
- author_url
- https://medium.com/@SQLShark
- status
- ok
- fetched_at
- 2026-06-16 19:09:56