Genome Expedition Series
I’m utilizing advantages and pitfalls of C. elegans genome data to demonstrate how to approach biological data using Python and Observable.
Genome Expedition Series
I’m utilizing advantages and pitfalls of C. elegans genome data to demonstrate how to approach biological data using Python and Observable.
Part I — introduction
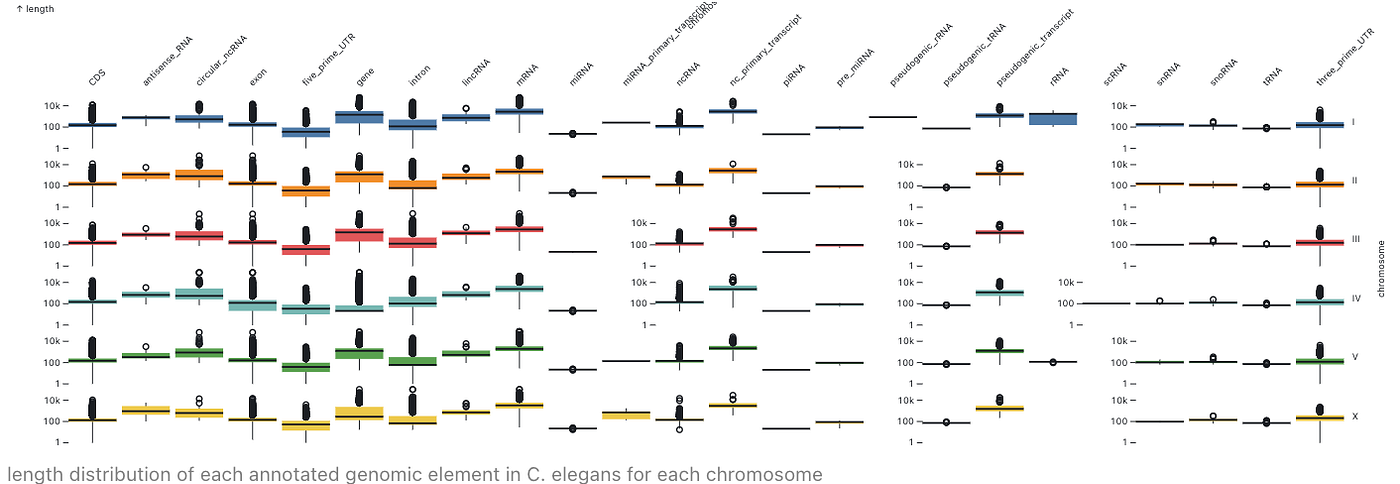
Genome expedition #1 — sneak peek at C. elegans genome
I give a brief introduction on where to find C. elegans genome annotations and structure of annotation data file. I demonstrate basic features using Python and Observable.
Genome expedition #2 — getting prepared for the genome
I implement Python functions to parse and shape existing genome annotation file into a more useful and refined format. This post creates the basis for annotation-dependent data analysis and visualization.
Genome expedition #3 — visualizing genomic elements
In this episode I benefit from the auto() plot functionality of Observable to look at different aspects of gene distribution among the genome. This is also a showcase of Observable’s grammer and capabilities. An interactive notebook version of the post can be also found here.
Genome expedition #4 — advanced visualizations
I use explicit Observable plotting functions to customize the look-and-feel of graphs on annotation data and provide deeper explanation of how different visual elements can be utilized . An interactive notebook version of the post can be also found here.
메타데이터
- post_id
- abecb1be17fb
- slug
- genome-expedition-series-abecb1be17fb
- url
- https://medium.com/@ahmetify/genome-expedition-series-abecb1be17fb
- canonical_url
- https://medium.com/@ahmetify/genome-expedition-series-abecb1be17fb
- author_url
- https://medium.com/@ahmetify
- status
- ok
- fetched_at
- 2026-06-09 15:37:30