How the UTMB Index scored the CCC 2024: a step-by-step case study
How do you get from a finishing time to a UTMB Index score? The 2024 edition of the CCC serves here as a testing ground. We walk through…
How the UTMB Index scored the CCC 2024: a step-by-step case study
How do you get from a finishing time to a UTMB Index score? The 2024 edition of the CCC serves here as a testing ground. We walk through the four steps of the calculation, from the search for similar races to the final asymmetric regression, following three runners from the men’s top 10 with contrasting profiles.
· · ·
CCC, 100 km Final of the UTMB World Series
Eighteenth edition in 2024. Over the years, the CCC has become one of the most competitive fixtures in world trail running and the final of the 100 km category on the UTMB World Series circuit. Courmayeur-Champex-Chamonix: the name says the route. About a hundred kilometers and roughly 6,000 m of positive elevation gain across the Italian-French-Swiss Alps, start at 9 a.m. from Courmayeur on the last Friday of August, arrival in Chamonix after a partial loop around the Mont-Blanc massif.
The course is never quite the same from one year to the next. Negotiated passage permits, trail renovations or temporary closures. Each edition shifts the distance by a few hundred meters and the elevation by a few dozen. Enough to ensure that finishing times are never directly comparable.
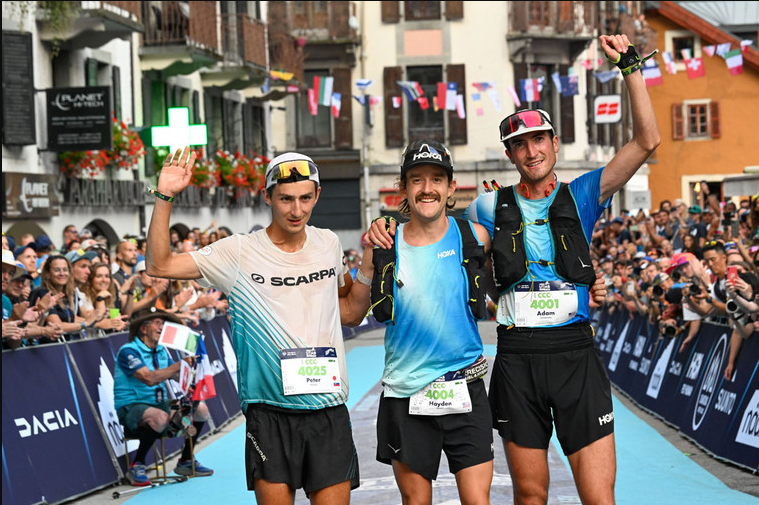
Scratch podium of CCC 2024
Year after year, the CCC attracts the world’s best 100 km mountain specialists, and the top ten regularly finish within one hour of each other. It’s a race where real confrontations play out, and where the finishing times at the top of the rankings faithfully reflect the level of the runners involved.

Last five editions of the CCC. The courses vary by barely 2% from one year to the next, but the winner’s finishing times differ by nearly thirty minutes and the DNF rate fluctuates between 18% and 28%.
Over the last five years, five different winners. The courses vary by only 2% from one edition to the next, but the winner’s times spread over 5%, between 9h53 and 10h23. The scores, however, stay even tighter: 3% spread, between 938 and 968. The DNF rate varies from 18% to 28%. Given comparable depth of talent at the start, such amplitude suggests significantly different race conditions from one edition to the next.
These numbers directly raise the question that interests us: how does the model produce tight scores from finishing times that vary so widely? To answer it, two contrasting editions will serve as analytical ground: 2022 and 2024.
Extreme conditions: 2022 and 2024
In the previous table, two editions sit at opposite ends of the spectrum.
2022 is the fastest edition of the last five years: Petter Engdahl wins in 9h53, at 9.97 km/h on average, with a DNF rate of 18%, the lowest over the period.
2024 is the opposite: Hayden Hawks wins in 10h20, at 9.71 km/h, with 28% DNF, the highest over the period. Twenty-seven minutes more than two years earlier.
And yet, the model places these two performances almost on par: 968 points for Petter Engdahl, 961 for Hayden Hawks. Seven points apart, where the raw times would suggest far more.
Running the CCC in 2022 and running it in 2024 is not the same thing. The course doesn’t explain it. The conditions do.
Two editions, two realities

Comparatif des deux éditions. Données météo issues du bulletin officiel des météorologues de l’UTMB. Distances, D+ et D- recalculés avec la même méthodologie sur les parcours UTMB Live.
The weather changes everything. In 2022, the pack runs in cool conditions: “6 to 14°C at 2,000 m, unstable skies, thunderstorms in the afternoon.” Difficult at times, but globally favorable for chrono performance. In 2024, everything flips: “Clear skies, 12 to 20°C at altitude, up to 30°C in the valley bottoms.” On an ultra that is mostly run during the day, the heat reshuffles the balance: hydration, thermal management, accelerated muscular fatigue. Finishing times feel it.
The DNF rate speaks for the rest. 18% DNF in 2022, 28% in 2024. One runner in four doesn’t finish, or 634 DNFs for 1,636 finishers. The gap is not trivial. It says that the 2024 edition was, on average, significantly harder to absorb than its predecessor.
The course itself also shifted. The finish in 2022 went via the Tête aux Vents, at 2,100 m, on terrain that was rather steep but runnable. In 2024, the route takes the Béchar, lower but via a significantly more technical trail, with winding sections and demanding descents. Less altitude, more muscular and technical stress in the final stretch. Here again, the effort-kilometer (KME) doesn’t capture this nuance: it aggregates difficulty, it doesn’t analyze its nature.
Add it all up: same KME, but opposite weather conditions, DNF rate up by ten points, and a more technical end to the course. None of these differences, taken in isolation, would invalidate a direct comparison. Taken together, they explain why Hayden Hawks doesn’t run as fast as Petter Engdahl, and why, despite this, their performances carry the same weight.
A coefficient for each edition
Calculating a score comes down to finding a function f(speed) = score. The fundamental choice of the model is that this function is linear and passes through the origin: f(v) = coefficient × v. This implies strict proportionality between speed and score. The score/speed ratio is constant for all runners of a given edition.
A runner twice as fast as another gets exactly twice as many points: the score at 8.28 km/h (800 pts) is exactly double the score at 4.14 km/h (400 pts).
The entire scoring problem therefore reduces to finding the right coefficient. And this coefficient is different for each edition of each race.

Scoring line of CCC 2022. The edition’s coefficient sets the slope, the same for all finishers: at 9.97 km/h, Petter Engdahl scores 963 points. Applied as-is to Hayden Hawks’ speed in 2024 (9.71 km/h), this line would produce 938 points. He scored 961. In other words, CCC 2024 does not have the same line as CCC 2022.
Why this gap? Because the coefficient absorbs everything that separates two editions: course, weather conditions, competitiveness of the field. The question becomes: how do we find it?
Our goal: explain how the system scores CCC 2024, step by step.
The UTMB Index system solves this problem in four steps:
- Search for similar races in the UTMB Index database
- Calculation of expected scores and the stability index of finishers
- Asymmetric linear regression to find the coefficient
- Calculation of scores for all finishers
This article describes them one by one, applied to CCC 2024. Three runners serve as a common thread:
- Hayden Hawks: 1st, has already run OCC and ultra formats
- Dakota Jones: 9th, has already run CCC and ultra formats
- Arnaud Bonin: 10th, has already run OCC, first 100 km under his belt

CCC 2024 women’s podium
UTMB Index scoring is based on the scratch ranking of the race: men and women are evaluated on the same scale, with the same edition coefficient. The men’s and women’s competitions at the CCC are both contested at the highest level, each with their own podium and their own dynamics. However, the model sees only one race: it does not exploit the internal dynamics of a gender or age-category podium, it scores all finishers together. In the regression pool of the 2024 edition, men and women contribute together to calibrating the coefficient, according to the same criteria of speed and stability.
Step 1. Search for similar races
To score an edition, the model needs reference points: runners whose level it already roughly knows, and whom it will find again in the peloton of the target race. These runners’ past performances still need to be genuinely informative. A runner who just completed a runnable 50 km teaches the model nothing about what they’re worth on a 100 km mountain race. The reverse, however, holds: a runner capable of completing a 100 km will bring information to bear on a 50 km. The model therefore exploits histories asymmetrically: longer races inform shorter races, not the other way around.
The first step therefore consists, for each Finisher, of building the list of races from their history that sufficiently resemble the target race to be usable.
What the model is allowed to look at
When a race organizer sends their results to UTMB Index, they transmit very little information: course distance, positive elevation, negative elevation, and for each runner: first name, last name, date of birth (to distinguish homonyms), and race time. The DNF list is optional and often missing. The system therefore cannot rely on it: only finishers are used to calibrate scores.
And these three numbers are themselves approximate: the official announcement (“100 km and 6,000 m of D+”) is rarely measured precisely, and the actual route followed by runners can deviate from it by several kilometers for distance and several hundred meters for elevation. It is for this reason that scoring based solely on average speed (distance divided by time) is excluded: the calculation would be distorted from the outset by the imprecision of the input data. The search for similar races must therefore be tolerant: it must accept reasonable gaps without becoming so permissive as to include unrelated races.
CCC 2024 as the target race
CCC 2024: 101 km, 6,050 m of D+, 6,235 m of D- on paper. It is from these three numbers that the model will set out to find comparable races in its database of about 30,000 races.
The comparison logic boils down to two criteria: distance, and elevation density (the ratio between total elevation and distance, which tells whether the course is runnable or vertical). The closer two races are on these two axes, the smaller their similarity gap. Zero means identical courses. As we move away, the number rises.
The model also applies an effort filter upstream (to rule out races that are notoriously too easy) and limits its search to the last four years. The important thing to remember: among the surviving races, each one receives a similarity gap Δ, and this number is what will weigh in the rest of the calculation.
Four examples among the retained candidates
Out of the thousands of races in the database within the considered window, let’s see what the calculation gives for four of them. They illustrate well the diversity of profiles the model has to handle.

Example of four races similar to CCC 2024. Elevation profiles displayed to scale: the visual width is proportional to the actual distance. The similarity gap (Δ) is calculated from the distance and elevation density. Zero means a course identical to the target.
Two groups emerge.
The twins. The UT4M 100 Master 2023 and CDH 2021 are within less than 0.02 similarity gap Δ of CCC 2024. They are virtually the same races in terms of distance and vertical density. A runner who has completed one of them provides the model with almost direct information on what they might be worth on CCC 2024.
The distant cousins. The Grand Trail des Templiers is shorter (81 km) and more runnable (43 m of D+ per km, versus 60 m/km for the CCC). The Diagonale des Fous is much longer (167 km) and more hilly (58 m/km, close to the CCC, but 66 km more). Their similarity gaps Δ (0.145 and 0.176) are ten to fifteen times higher than those of the twins. Their finishers teach the model less, but are not disqualified for all that.
The trade-off between similarity and volume
These two groups present a tension that the model must constantly manage.
The UT4M and the CDH offer the most precise anchoring, but they only gathered 361 and 619 finishers. Finding many CCC 2024 runners in these two pelotons is statistically unlikely. The Templiers and the Diagonale, for their part, totaled more than 4,000 finishers between them. The probability of finding CCC 2024 runners in these pelotons is significantly higher, but each match brings a noisier signal.
The model exploits both. The performances of runners found in UT4M or CDH weigh heavily in the calculation of their expected score, because the similarity gap Δ is very small. Those found at the Templiers or the Diagonale weigh less, but contribute to refining the prediction, especially when nothing closer is available.
It is precisely this weighting that the next step will implement, applying it to the complete history of the three runners we are following.
Step 2. Calculation of expected scores
The previous step showed how the model identifies races comparable to CCC 2024. We now change perspective: instead of starting from the race, we start from the runner. For each Finisher of CCC 2024, the model will go through their race history to produce two key numbers.
The first is the expected score: the score this runner should achieve on CCC 2024 if we rely solely on their past performances. The second is the stability (Stability Index), a confidence index in this prediction between 0 and 1. A runner who strings together similar races with consistent results will be predictable and close to 1. A runner with little history or erratic performances will be much less so — they’ll be close to 0.
These two numbers will then determine the anchoring and weight of each Finisher in the regression of step 3.
The prediction in four stages
The expected score is built in four stages.
Filtering the history. We take all the runner’s races over the past 4 years, and keep only those that appear in the similar race database (from step 1).
Weighting of each race. Each race receives a weight that combines three factors: recency (recent races weigh more than older ones), proximity to CCC 2024 (the smaller the similarity gap, the higher the weight), and possible bonuses. A previous edition of the same race benefits from the strongest bonus. A race from the same event, in a different format (for example the OCC for a runner being evaluated on the CCC), receives a more modest bonus.
Exclusion of bad days. If a runner has at least three candidate races, those with a score significantly lower than their personal median are discarded. The model seeks to predict what a runner can do, not what they do on days when everything goes sideways.
Selection of the top 5 and weighted average. The five races with the strongest combined weight are retained, then sorted by descending score. The best receives the highest rank weight, the following ones a decreasing weight. The model assumes that a runner’s best score better reflects their actual level than an average performance: a big race is prepared for, and the finishing time that comes out of it is rarely the result of chance. Conversely, the notion of overperformance does not exist in the history: the model does not seek to discard an exceptional result as an accident.
Stability: how much confidence to put in the prediction?
The expected score, on its own, doesn’t say how much we can trust it. For that, the model calculates a stability index between 0 and 1, from four factors.
- F1: Experience. Number of races in the target category (100 km for the CCC), increased by a bonus if the runner has already run an event from the same family.
- F2: Variability. Consistency of past scores. Tight performances around an average give a high F2. Wildly oscillating scores bring it down.
- F3: Relevance. Quality of the anchoring. Having run a previous edition of the target race, or very similar races, raises this factor.
- F4: Recency. Recent activity, ideally in the target category.
These four factors are combined into a raw score, which then passes through a non-linear function: high raw scores are pushed toward 1, low ones are crushed toward 0. A well-anchored runner sees their stability confirmed. A poorly anchored runner sees it collapse. The model deliberately amplifies contrasts so that the final regression rests on the most reliable runners.
Let’s move on to the three concrete cases.
Hayden Hawks: the ultra specialist without a CCC under his belt

Expected score: 939. Stability: 0.884.
Hayden Hawks is an American specialist of 100 km and 100 mile formats. His history is dense, consistent, and his latest Western States (June 2024) alone accounts for 42.6% of the calculation. It is his most recent race, only two months before CCC 2024, and in a format very comparable in commitment.
The breakdown of his stability is interesting: F1 at 0.867 (many races in the target category), F2 at 0.888 (very consistent scores between 888 and 955), F4 at 0.900 (abundant recent activity). These three pillars place him at the top of the table. But F3 falls to 0.278, because Hawks has never run the CCC. The model relies on similar races without ever having a direct anchor. The final stability remains high (0.884) because the weighted average of the four factors stays above the threshold where the non-linear function pushes upward.
The model classifies him as a highly predictable runner, without being able to predict precisely what he’s worth on this race in particular. Expected score: 939. Actual score: 961. An overperformance of 22 points.
Dakota Jones: direct anchoring thanks to CCC 2023

Expected score: 896. Stability: 0.888.
Dakota Jones is the textbook case of the predictable runner. He already ran the CCC in 2023 (917 points), which activates the bonus and propels this race to 44.6% of the total prediction weight, by far the highest contribution among the three runners studied. Two editions of the Transvulcania, plus Hardrock and Western States, complete a varied but consistent history on long mountain formats.
His stability rests on an almost perfect balance between the four factors: F1 at 0.800, F2 at 0.772, F3 at 0.568 (the best of the three thanks to CCC 2023), F4 at 1.000 (maximum recent activity). No weak points, and direct anchoring on the target race. The final stability of 0.888 is slightly higher than Hawks’, despite a slightly lower F1 and F2, because F3 makes up for the whole.
Result: expected score 896, actual score 887. Nine points difference, a performance almost perfectly matched to the prediction.
Arnaud Bonin: the unknown of the 100 km

Expected score: 871. Stability: 0.184.
Out of his entire history, only four races passed the similarity filter of step 1. That’s little, and that makes Arnaud Bonin the most uncertain runner of the trio. No race in the target distance of 100 km. The Grand Trail des Templiers (81 km) carries the highest weight in the calculation despite the absence of a bonus, because its format is closest to the CCC. The three OCCs (55 km) benefit from the event bonus, but on half the targeted distance.
The breakdown of his stability tells the story of this thin history in the category: F1 at 0.467 (few races, and none in the target category), F2 at 0.100 (history too limited and too heterogeneous to establish reliable variability), F3 at 0.273, F4 at 0.500. The raw score falls to 0.303. And this is where the non-linear function plays the other way: a raw score below 0.5 is crushed downward. Result: a final stability of 0.184, five times lower than Hayden Hawks’ and Dakota Jones’.
Expected score: 871. Actual score: 886. A performance slightly above the prediction.
Three profiles, three degrees of confidence
The numbers tell three very different stories. Hayden Hawks and Dakota Jones match each other in stability (0.88 vs 0.89), but for opposite reasons. Hayden Hawks compensates for the lack of direct anchoring with exceptional experience volume and consistency of performance. Dakota Jones presents a more balanced profile, with a CCC 2023 that directly anchors the prediction. Arnaud Bonin, on the other hand, simply doesn’t have enough material for the model to speak with confidence.
These confidence levels are not cosmetic. In the next step, the regression that determines the 2024 edition’s coefficient will weight each Finisher by their stability. Hayden Hawks and Dakota Jones will therefore weigh heavily in the final calibration. Arnaud Bonin, much less. The model relies on the runners it knows well to infer the level of the race, then applies the result to everyone.
Step 3. Asymmetric regression
The two previous steps produced, for each Finisher of CCC 2024, an expected score and a stability. We therefore have more than 1,600 triples of the form (observed speed, expected score, stability). The goal of step 3 is to find the single coefficient that links speed to score for this edition.
But we don’t run the regression on the 1,636 finishers. We run it on a carefully chosen subset, which we call the regression pool. The objective is to reduce noise. In the second half of the pack, race conditions change: runners encounter bottlenecks on technical sections, cross the same portions of the course at different times (with therefore different weather conditions: afternoon heat, night cool or rain), and their irregular profile blurs the signal. A runner who finishes ten hours behind the winner does not bring the same information about the edition’s level as a runner who arrived in the same window as him. To calibrate a quality line, we will select the most informative runners.
Filter by speed
First selection, on a simple criterion: speed. The model discards all finishers whose time exceeds double the winner’s time.
On CCC 2024, Hawks wins in 10h20. The threshold is therefore set at 20h40. Of the 1,636 finishers, 648 finish within this allotted time. It is from these that the pool will be built.
This filter does two things. First, it eliminates runners whose final score would in any case be below 480 points, a level where the model’s linearity is less sensitive to coefficient variations. Then, it keeps the runners whose performances most faithfully reflect the level of the edition, those who actually raced the course rather than just finished it.
The runners excluded from the pool are not excluded from the scoring. They will receive their score in step 4, when the line is applied to the entire pack. The selection only concerns the calibration of the coefficient.
Keep only runners with an expected score
Of the 648 finishers below the threshold, 590 have a computable expected score (91%). The remaining 9% are either runners without usable history, or runners whose past races don’t satisfy the similarity criteria of step 1. They are excluded, because there is nothing to predict for them.
So we end up with 590 eligible finishers: fast, and with a historical anchor.
Set the size of the pool
Selecting all 590 would be excessive. Many have low stability, and their massive inclusion would dilute the signal of truly reliable runners. The model therefore sets a pool size that grows with the square root of the number of eligibles, according to a fixed coefficient.
For CCC 2024: 4 × √648 = 102 runners. That’s the number the regression will use.
This rule ensures a balance. On small races, we take almost everyone so as not to weaken the regression. On large races like the CCC, we select a tight, high-quality sample rather than burdening the calculation with hundreds of noisy runners.
The 80/20 split: Elite and Stable
It remains to choose which ones among the 590 eligibles. The pool consists of two subgroups with complementary roles that the model calls Elite and Stable. These two names are technical labels, not sporting judgments: a runner who is “Elite” in the model’s sense is simply the fastest in their race.
80% Elite runners, selected by race time, fastest first. On CCC 2024, that gives 82 Elite runners. They are the ones making the race. Their times best reflect the actual conditions of the edition, because they ran fast, early in the day, and in a dynamic of direct confrontation.
20% Stable runners, selected by decreasing stability from among the remaining eligibles. On CCC 2024, that gives 20 Stable runners. These are runners whose level the model knows very precisely, whether they finish in the top 50, top 100 or beyond, as long as their history makes their score highly predictable.
The logic of the split is one of consensus. The Elite tell one version of the race: “here’s what we could do in 2024’s conditions.” The Stable tell another: “here’s what runners whose level is well known produced in those same conditions.” The final coefficient is a compromise between these two versions. If the two groups converge, the regression is solid. If they diverge, the model identifies the equilibrium point that best explains both signals.

Three views of the CCC 2024 regression pool. At the top, the selection parameters: 1,636 finishers in total, 648 under the speed threshold, 590 with a computable expected score, 102 retained in the final pool (82 Elite + 20 Stable). At bottom left, the asymmetric regression: each point is a runner from the pool, positioned by their speed (x-axis) and their expected score (y-axis). The dashed line is the edition’s final coefficient (c = 98.3 points per km/h). At bottom right, a second reading: expected score vs obtained score. The further a point is from the diagonal, the more the runner deviated from what their history led us to expect. Above, overperformance. Below, underperformance. Color codes stability: yellow points (stability close to 1) contribute more to the calibration than purple points (stability close to 0.25).
Where do our three runners land?
All three finish in the top 10, well under the 20h40 threshold: they all enter the Elite subgroup. But their respective weights in the regression will reflect the quality of their prediction: Hayden Hawks and Dakota Jones, with stabilities above 0.88, contribute fully. Arnaud Bonin, with a stability of 0.184, contributes more modestly. That is precisely what stability-weighted regression makes possible: accounting for each signal to the extent of what it’s worth.
Calibrating the line
With the pool constituted, the regression can operate. Let’s recall its objective: find the coefficient c such that the line f(v) = c × v best fits the (speed, expected score) pairs of the pool, weighted by each runner’s stability.
A classical linear regression (least squares method) gives a first initial coefficient: for CCC 2024, around 358,114. But this method treats gaps above and below the line symmetrically, which does not correspond to sporting reality. The model applies an asymmetric regression: overperformances are examined with more rigor, underperformances treated with more leniency, and the severity adapts to the runner’s level. It remains to be seen how the 2024 edition, with its own characteristics, adjusts this asymmetry.
Contextualizing the asymmetry for CCC 2024
The model’s asymmetry is not fixed: it adapts to the edition’s characteristics. Three parameters modulate it, and each takes a specific value on CCC 2024.
Steepness. With 122 m/km of cumulative elevation (D+ and D- combined over the distance), CCC 2024 sits in the upper bracket of long-distance trail. A very steep course means, statistically, more technical terrain, more selective, where gaps between runners reflect specialization more than raw speed. The model slightly softens its judgment on underperformances and slightly hardens that on overperformances.
Altitude. The high points of CCC 2024, the Tête de la Tronche and the Grand Col Ferret, rise above 2,500 m. Without being a high-altitude ultra like some Asian or Andean races, the edition goes high enough for the model to adjust its requirements. On average, elites are better adapted there than amateur runners: mountain stays, training camps, history of alpine races. A performance far above expectations at altitude remains possible, but it is examined with more caution.
Competitiveness. The edition’s competitiveness index, based on the tightness of gaps between the top ten, comes out at 0.69 after modulation by race duration. It’s a dense field, consistent with its status as UTMB World Series 100 km final. In this context, the asymmetry loosens slightly: the top runners’ overperformances gain credibility, because the field’s emulation justifies strong times.
These three parameters do not change the general shape of the regression: they adjust the severity with which it judges deviations from the prediction, one way or the other, at each runner’s level.
The final coefficient
After optimization on the pool of 102 runners, the asymmetric regression produces a coefficient of 98.3 points per km/h.
This is the line that represents the 2024 edition. It will be applied to all Finishers in step 4, whether they are in the pool or not.
We now have everything we need to calculate each finisher’s score.
Step 4. Calculation of scores
The three previous steps produced a single number, but an essential one: the 2024 edition’s coefficient. The line f(v) = c × v is now calibrated. The fourth step is the simplest of the four. All that’s left is to read, for each Finisher, the score corresponding to their speed.
Reading the line
The line is the same for all Finishers of the edition. It doesn’t know the runner’s name, their history, their country, their age. It only translates a speed into a score, according to the proportionality set by the 2024 coefficient.

The table above gives the complete grid for the 2024 edition. It reads both ways. At a given speed, what score does a runner obtain? At a targeted score, what time must be achieved? On CCC 2024, you had to cross the line in 9h55 to reach exactly 1,000 points. Finishers below 500 points are those who took more than 19h51 to complete the course.
This grid changes from one edition to the next. On CCC 2022, the fastest edition of the period, you had to complete the course in 9h34 to reach 1,000 points. In 2024, this same threshold fell to 9h56, over twenty minutes of margin. This reference time is neither a physiological ceiling nor a target to reach: it is a direct consequence of the edition’s scoring line. Since the model is linear, each edition boils down to a coefficient, and therefore to a time that mechanically equals 1,000 points. Engdahl in 2022 did not cross that threshold: he did 9h53 for 968 points. Hawks in 2024 did not either: 10h20 for 961 points.
The 1,000 points could theoretically be exceeded: it is neither a physiological ceiling nor a maximum value imposed by the model, simply the time at which the edition’s line crosses this value.
What follows from this is at the heart of the principle of per-edition scoring: the same performance in minutes doesn’t carry the same value from one year to the next, because the conditions that made it possible were not the same.
The error cancels out within the edition
A detail can be troubling: if the announced distance and elevation are imprecise, how can the speed entering the regression produce a fair score? The error cancels out. Within an edition, all runners share the same official numbers. If CCC 2024 is announced at 101 km when the actual route is 103, all speeds are underestimated in the same proportion, and the regression compensates: it produces a slightly higher coefficient, which gives back the correct scores. No ranking moves. What matters is not absolute speed, but the hierarchy of speeds within the edition, and that hierarchy is preserved.
The top 10 under the microscope

The final top 10 of CCC 2024, after application of the edition’s coefficient (98.3 pts/km/h). The “New Score” column gives the score obtained. The “Expected / Stability” column recalls the prediction from step 2 and the associated confidence level. The gap between the two numbers tells whether the runner overperformed or not.
Applied to the top 10, the line produces scores tightly grouped between 885 and 960 points. The top ten are within 53 minutes of each other at the finish and within 75 points on the score, confirming the density of the leading field. The gap between 1st and 2nd (11 points, for 7 minutes) is slightly wider than the gap between 3rd and 10th (62 points, for 44 minutes): the hierarchy is compressed behind the winner, with a few seconds or minutes separating several positions.
The column of expected scores tells another story. Seven of the top ten overperformed their prediction, sometimes by more than fifty points. The other three are within the expected range. None underperformed, which is logical: a bad day would have cost enough minutes to drop out of the top 10. The top of the ranking of a major race is mechanically populated by runners who either did exactly what was expected of them, or found something extra. The others are further behind.
Back to our three runners
Hayden Hawks (961 points). On the grid, 10h20 corresponds to a score around 960 points. This is a clear overperformance of 22 points compared to what his history suggested (939). His race highlights a margin of progression that the model could not anticipate from his prior data alone. The sign of a runner crossing a threshold, or expressing a potential his previous races had underestimated. The emulation of the field also plays a part: with Peter Frano less than seven minutes behind, Hawks could never let up.
Dakota Jones (887 points). At 11h12, Jones is almost exactly on his prediction. Only nine points below, which represents less than 1% difference. It’s the perfect case: a predictable runner, with direct anchoring thanks to his CCC 2023, who produces a performance consistent with his history. For the model, no new information. Dakota Jones did what he was supposed to do.
Arnaud Bonin (886 points). At 11h12 also, Arnaud Bonin scores almost the same as Dakota Jones: 36 seconds separate them on the clock, one point on the score. But the story is completely different. Arnaud Bonin started with an expected score of 871, based primarily on his experience of the OCC and the Grand Trail des Templiers. He scores 886, 15 points above. On paper, it’s an overperformance. In reality, it’s above all the first time the model has a direct signal on what Arnaud Bonin is worth on 100 km of mountain. At his next race in this category, the score of 886 will enter his similar-race history, and his stability will rise as the model accumulates data on his actual level on 100 km.
What the score tells
These three stories remind us what the score does, and what it doesn’t do.
What it does: place each runner on a unified scale, consistent across races and across editions, taking into account the actual conditions of each event. Dakota Jones at 887 points on CCC 2024 and at 917 on CCC 2023: two scores produced by the same mechanism, each calibrated on the conditions of its edition. If there are 30 points of gap between the two, it’s because he performed a little less well in 2024, not because one of the two editions was easier than the other. This is precisely what per-edition scoring makes possible: making performances comparable beyond the conditions.
What it doesn’t do: judge the runner’s actual effort, their pain, their strategy, their pleasure. A score of 886 and a score of 887 separate two performances that everything else distinguishes. Dakota Jones ran his race in management mode. Arnaud Bonin, in all likelihood, went to find something that wasn’t in his history. The model only sees the time. The rest belongs to the runner.
One race, one system
We just followed one edition. Four steps, a pool of runners, a coefficient, a reading grid of the race. What was described for CCC 2024 repeats, identically, for each of the more than 30,000 races in the UTMB Index database. Each new race entering the system triggers the same sequence: search for similar races, calculation of expected scores, regression on a pool of reliable runners, calculation of individual scores.
No race is treated differently from the others. A village trail goes through the same steps as the UTMB World Series final. Smaller races will simply have a smaller pool, lower overall stability, and less tight predictions. But the mechanics are the same, and the comparability of scores depends entirely on it.
This is what ultimately allows us to ask questions we didn’t know how to ask before. A runner who progresses from 700 to 800 points over two seasons, has he really progressed, or is it a calendar artifact? Is a performance at 920 points on an Asian race comparable to a 920 European? A winner who scores 940 on a weakly competitive race, does he really have the level of a winner at 940 on a dense field? The answers are not always obvious, but the system provides the tools to formulate them.
On CCC 2024, Hayden Hawks scored 961 points. Behind this number, there is a race, a pool of runners, a coefficient specific to the edition, and above all a logic that reproduces itself with each new event added to the database. It is this repetition, more than the precision of an individual score, that gives the system its value.
A score only has meaning if the score that follows, and the score that precedes, were produced according to the same rule. CCC 2024 is only one application among others of a mechanism that runs continuously, race after race.
Les auteurs
메타데이터
- post_id
- bf77ab91b72c
- slug
- case-study-scoring-the-ccc-2024-bf77ab91b72c
- url
- https://medium.com/@utmbgroup/case-study-scoring-the-ccc-2024-bf77ab91b72c
- canonical_url
- https://medium.com/@utmbgroup/case-study-scoring-the-ccc-2024-bf77ab91b72c
- author_url
- https://medium.com/@utmbgroup
- status
- ok
- fetched_at
- 2026-06-21 21:05:38